Introduction
This document helps new users create query-based custom monitors using PostgreSQL in OpsRamp. It guides users to implement PostgreSQL query-based metrics, configure monitors, and apply templates. It also outlines prerequisites, highlights limitations, provides troubleshooting steps, and answers frequently asked questions related to PostgreSQL database monitoring.
What Is PostgreSQL Database Monitoring
OpsRamp provides PostgreSQL Database Monitoring to help users track the health and performance of their PostgreSQL environments. It offers built-in performance metrics that allow users to visualize database availability and system health with ease. After logging into the OpsRamp portal, users can access real-time status updates and performance metric for specific PostgreSQL servers. For a complete list of available PostgreSQL metrics in OpsRamp, see PostgreSQL
How PostgresSQL Database Monitoring works
OpsRamp monitors PostgreSQL databases by executing SQL queries on target servers through a Gateway using JDBC connections. This process collects performance metrics and displays them in the OpsRamp interface.
Prerequisite
To enable monitoring, users must meet the prerequisites listed below.
- Ensure the database and port 5432 are reachable from the Gateway.
- Map a Gateway management profile to the target resource.
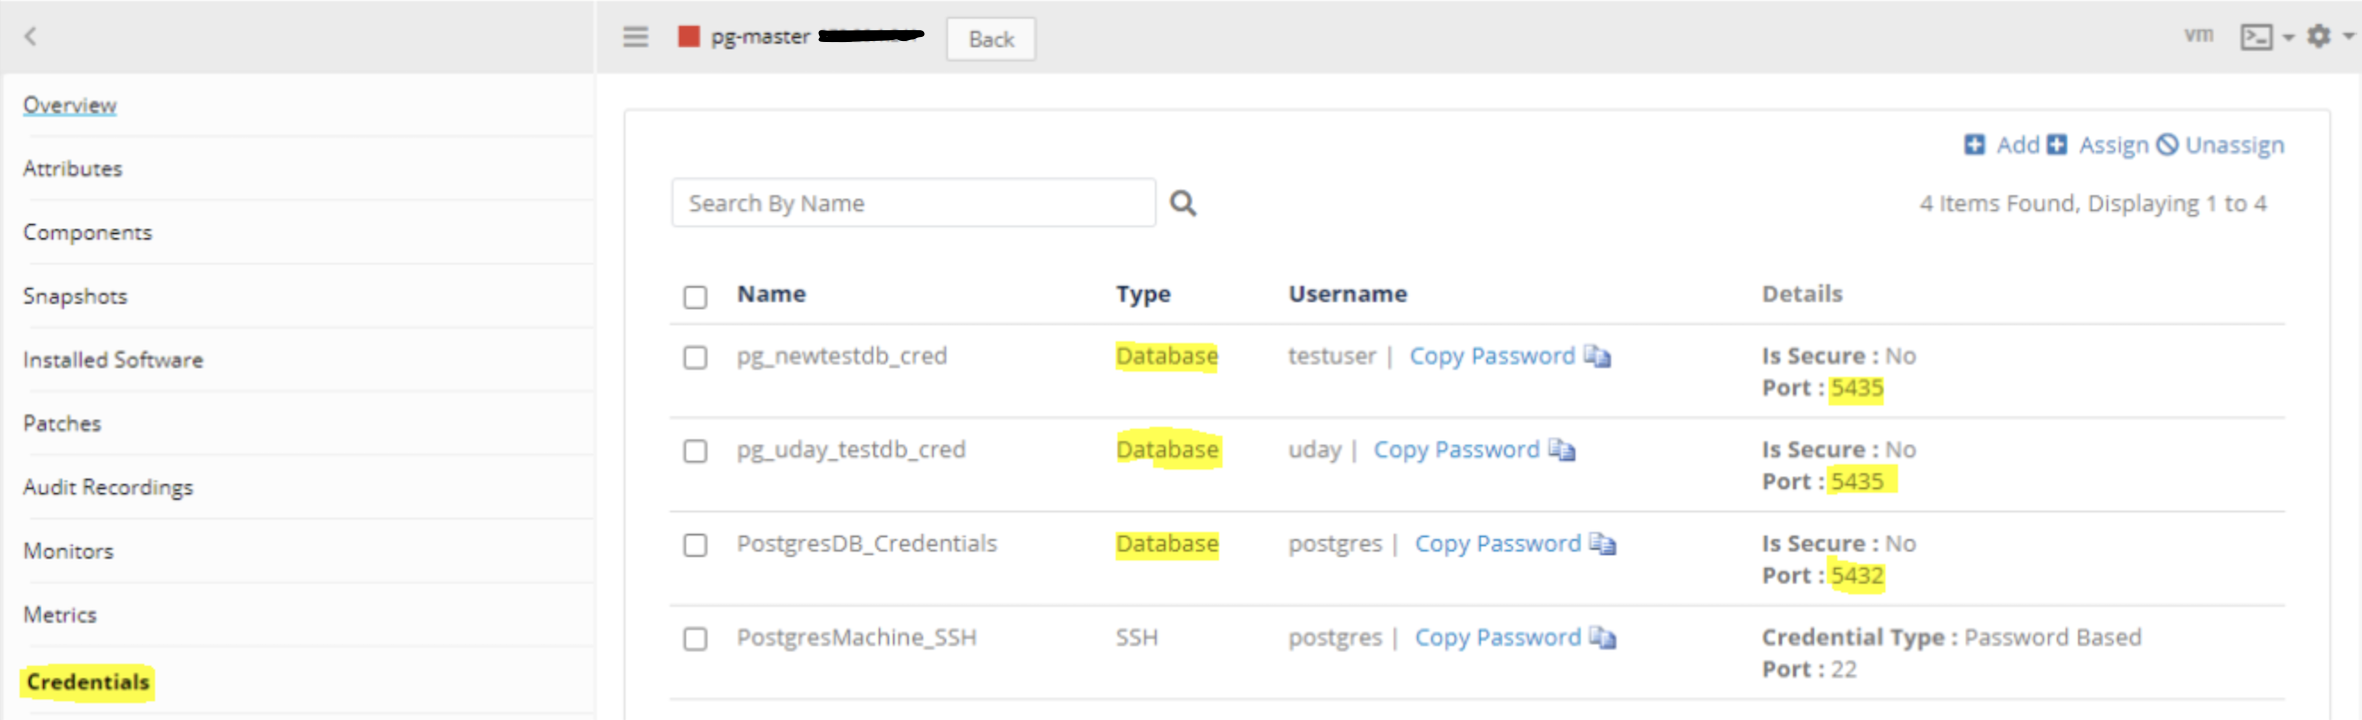
- Create credentials of type Database before assigning a template to the resource.The Port, Connection Timeout, and Is Secure values are not used when creating credentials.
- Enable privileges according to the PostgreSQL version used.
Privileges
| Version | Privilege |
|---|---|
| Before PostgreSQL v10 | pg_stat_database granted to username |
| PostgreSQL v10 and above | pg_monitor granted to username |
| PostgreSQL v10 and above | Grant the user EXECUTE permission for the pg_ls_dir function, for the monitored database. |
PostgresDB
Prerequisites for applying PostgresDB templates:
- Use Gateway 7.0.0 and above.
- Create a Postgres environment file and provide the file path as the input parameter while applying the template. Along with setting up the Postgres environment, make sure that the environmental file includes other parameters, such as PGDATADIR, PGWALDIR, PGDATABASE, PGARCHIVEDIR, and PGPORT. Also, after loading the environment file, the
pg_isreadyandpsqlcommands are available for the script to use. - Add the Postgres database credentials with the PostgresDB_Credentials set name.
- Assign the pg_monitor role to the user.
Template names:
G2-PostgresDB-Performance
G2-PostgresDB-Replication Running Status
To use the multi-instance functionality with the G2-PostgresDB-Replication Running Status template, the credentials set name needs to be updated in the monitor script. Also, end-users need to create the credentials using the same credential set name on the device.
Discovery using the gateway
The gateway establishes a connection to the database using the Java Database Connectivity (JDBC) Java API and collects metrics using SQL queries. To monitor PostgreSQL, install gateway version 5.0.0 or later.
Use one of the following mechanisms to discover PostgreSQL servers and add them to your inventory:
- WMI
- SSH
- SNMP
Optionally, manually add a database server to the infrastructure inventory:
- Select Infrastructure and click Resources.
- Click the Settings icon on the top-right and click Add.
- On the Add Device page, enter the Device Type and any other information you want to enter.
- Click Save.
You can also apply agent-based templates to initiate MS SQL monitoring.
Set up PostgreSQL monitoring
PostgreSQL monitoring setup involves:
- Associating appropriate database credentials to the discovered database.
- Assigning one or more database-specific global monitors or templates on the device. Optionally, create custom metrics or monitors using SQL queries and assign them to the database.
PostgresSQL query based monitoring development
How to develop and create PostgresSQL metric
OpsRamp provides a predefined set of PostgreSQL metrics. For users who want to customize and build their own monitoring solutions, it also offers UI-based support for creating PostgreSQL metrics.
To create a PostgreSQL metric, users must ensure their query returns no more than one or two fields. Use the following use cases and examples to learn how to write queries for monitoring your PostgreSQL environment.
How to Prepare a PostgreSQL Metric Query
Metric Without ComponentsTo create a metric query for a direct value without any components, return only one column in the query result. This single value will be treated as the metric value.
Examples:
To monitor the count of WAL segments in PostgreSQL.
Query
select count(*) as "wal segment count" from pg_ls_dir('pg_wal') as t(fname) where fname <> 'archive_status';

This metric query output is the count value of the wal segments, Here our framework should consider the value as metric value.</br>
To monitor the activity count in PostgreSQL.
Query
SELECT count(*) as "activity_count" FROM pg_stat_activity;
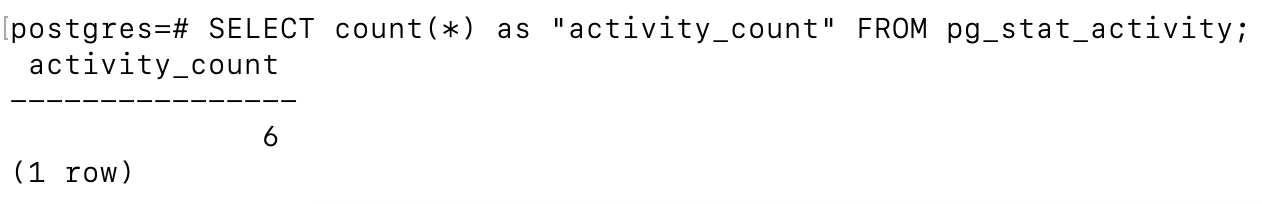
This metric query output is the count value of the activities, Here our framework should consider the value as metric value.</br>
Metric With Multiple ComponentsTo create a metric query for component-based metrics, return two columns in the query result. The first column will be treated as the component name, and the second column will be treated as the metric value.
Examples:
To monitor the number of transactions rolled back in each PostgreSQL database.
select datname, xact_rollback from pg_stat_database;
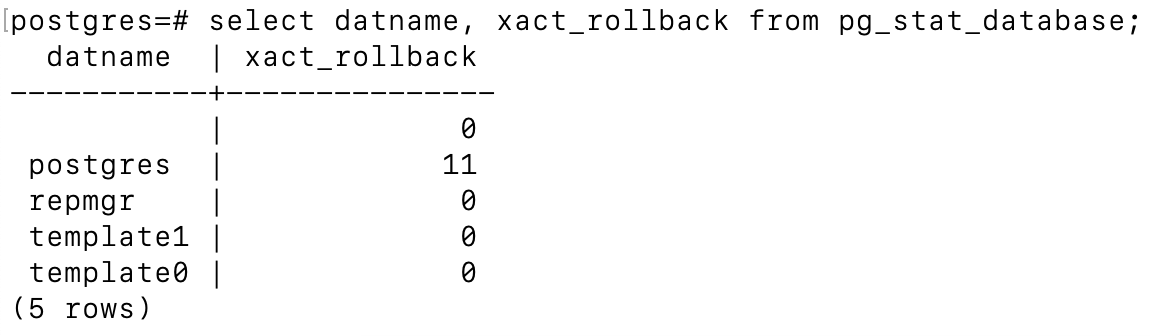
In this query:
- `datname` identifies component name
- `xact_rollback` provides metric value
To monitor the size of the each PostgreSql Database.
Query
select datname as db, pg_database_size(datname) as size from pg_database;
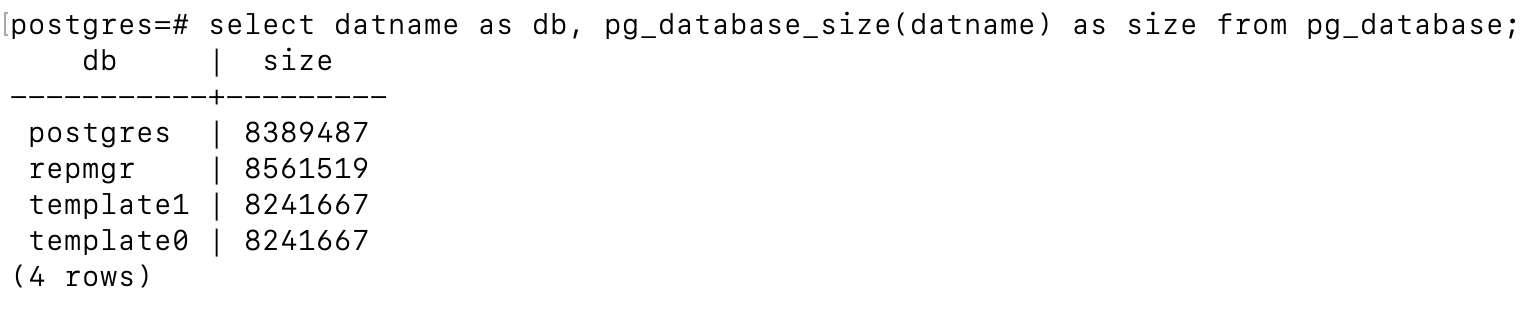
In this query:
- `db` identifies the component name
- `size` provides metric value
Note
- Users must follow the documented use cases when preparing queries for database query-based monitoring.
- When creating metric queries with multiple components, the OpsRamp framework displays component names in the format <InstanceName-ComponentName> or <Port_InstanceName-ComponentName> (the port number is included if the target environment contains multiple instances running on different ports).
- Metric queries must return a maximum of two columns:
- If the query returns one column, it is treated as the metric value.
- If the query returns two columns, the first column is treated as the component name, and the second column as the metric value.
- Metric values must be numeric. If the query returns string-type values, users must apply enumerated mappings; otherwise, graphs will not be plotted. For more details, refer to How to Handle Enum Mappings & Alerting.
How to calculate/format metric values with example queries
To calculate metric values such as utilization, memory conversions (e.g., GB to MB), and time conversions (e.g., seconds to milliseconds), follow the examples below for better understanding.
Examples:
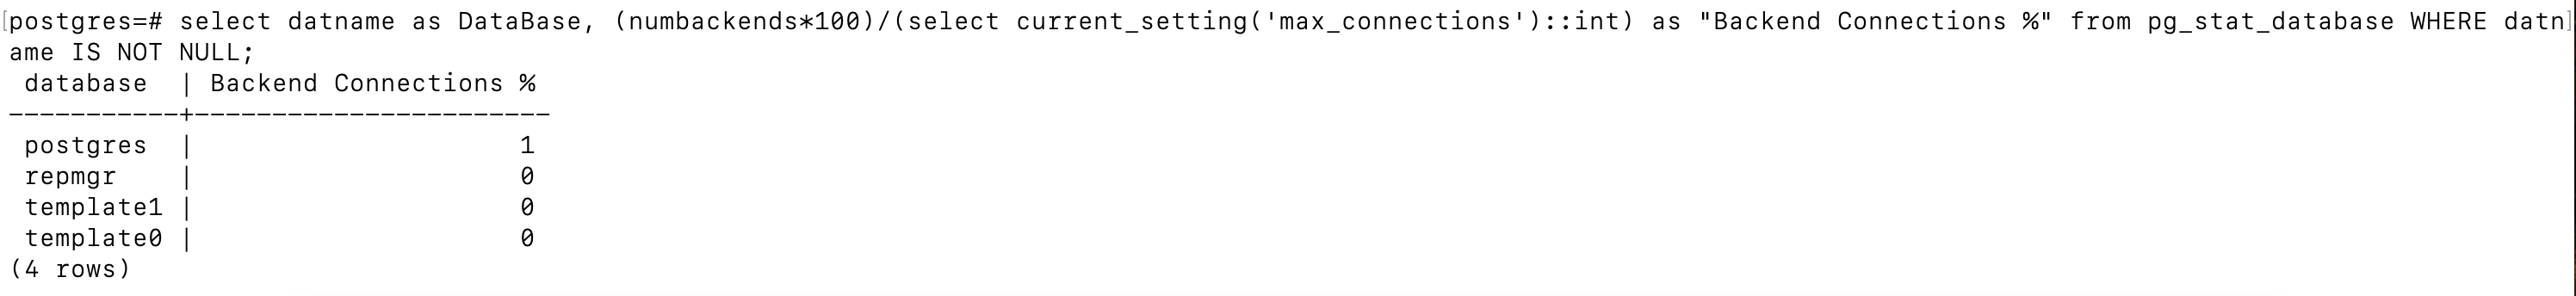
To monitor utilization of the backend connections (relative to max_connections) in PostgreSQL.
Query
select datname as DataBase, (numbackends*100)/(select current_setting('max_connections')::int) as "Backend Connections %" from pg_stat_database WHERE datname IS NOT NULL
To monitors the Time (in Hours) for long transactions in PostgreSQL.
Query
select application_name,extract(epoch from (now() - xact_start)/3600)::int as time from pg_stat_activity WHERE state IN ('idle in transaction', 'active') AND xact_start IS NOT NULL;

How to handle enum mappings & Alerting
Enumerated Map:
OpsRamp monitoring framework supports only integer-type metric values, so users must return metrics as integers—not as strings or other data types. If users prefer to work with string values, they can apply enum mappings to convert those strings into integers. The following are few examples providing further clarification.
Example:
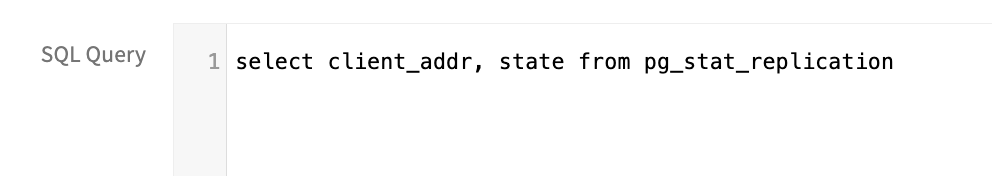
To monitor the replication status of PostgreSql, it’s important to note that we have different possible states. In such cases, users must prepare a query to directly return the status value for the current replication status, as illustrated in the following:
Query
select client_addr, state from pg_stat_replication;
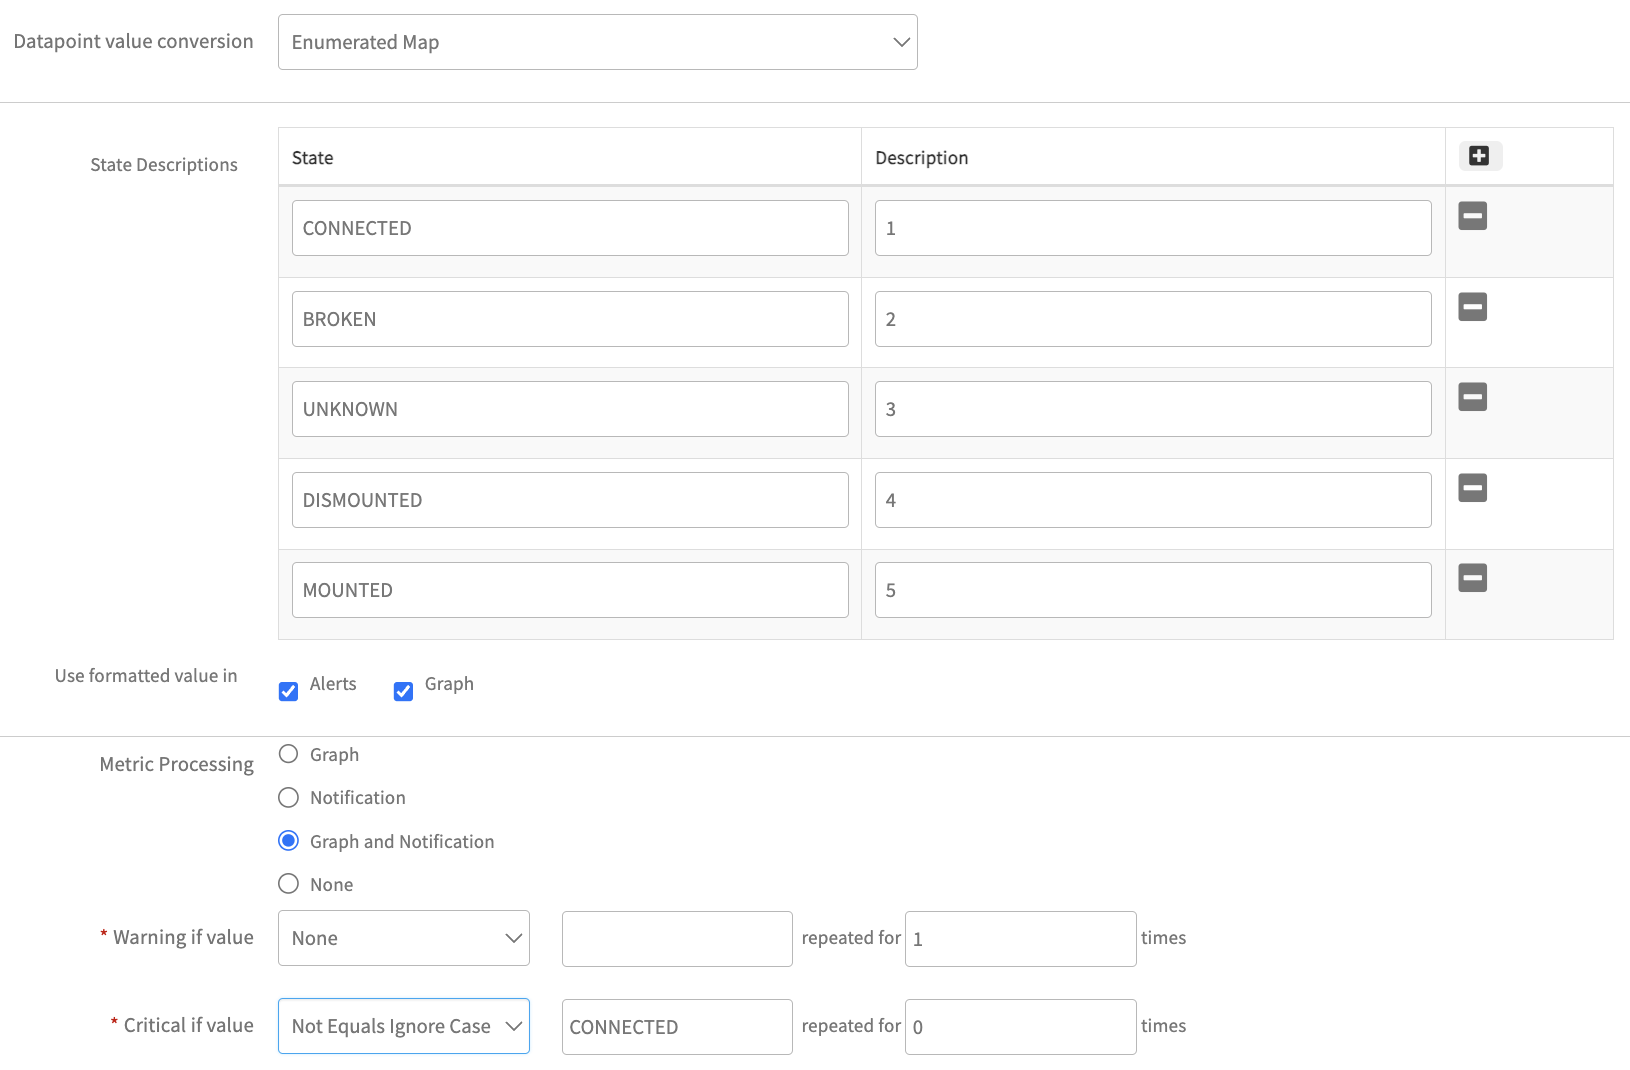
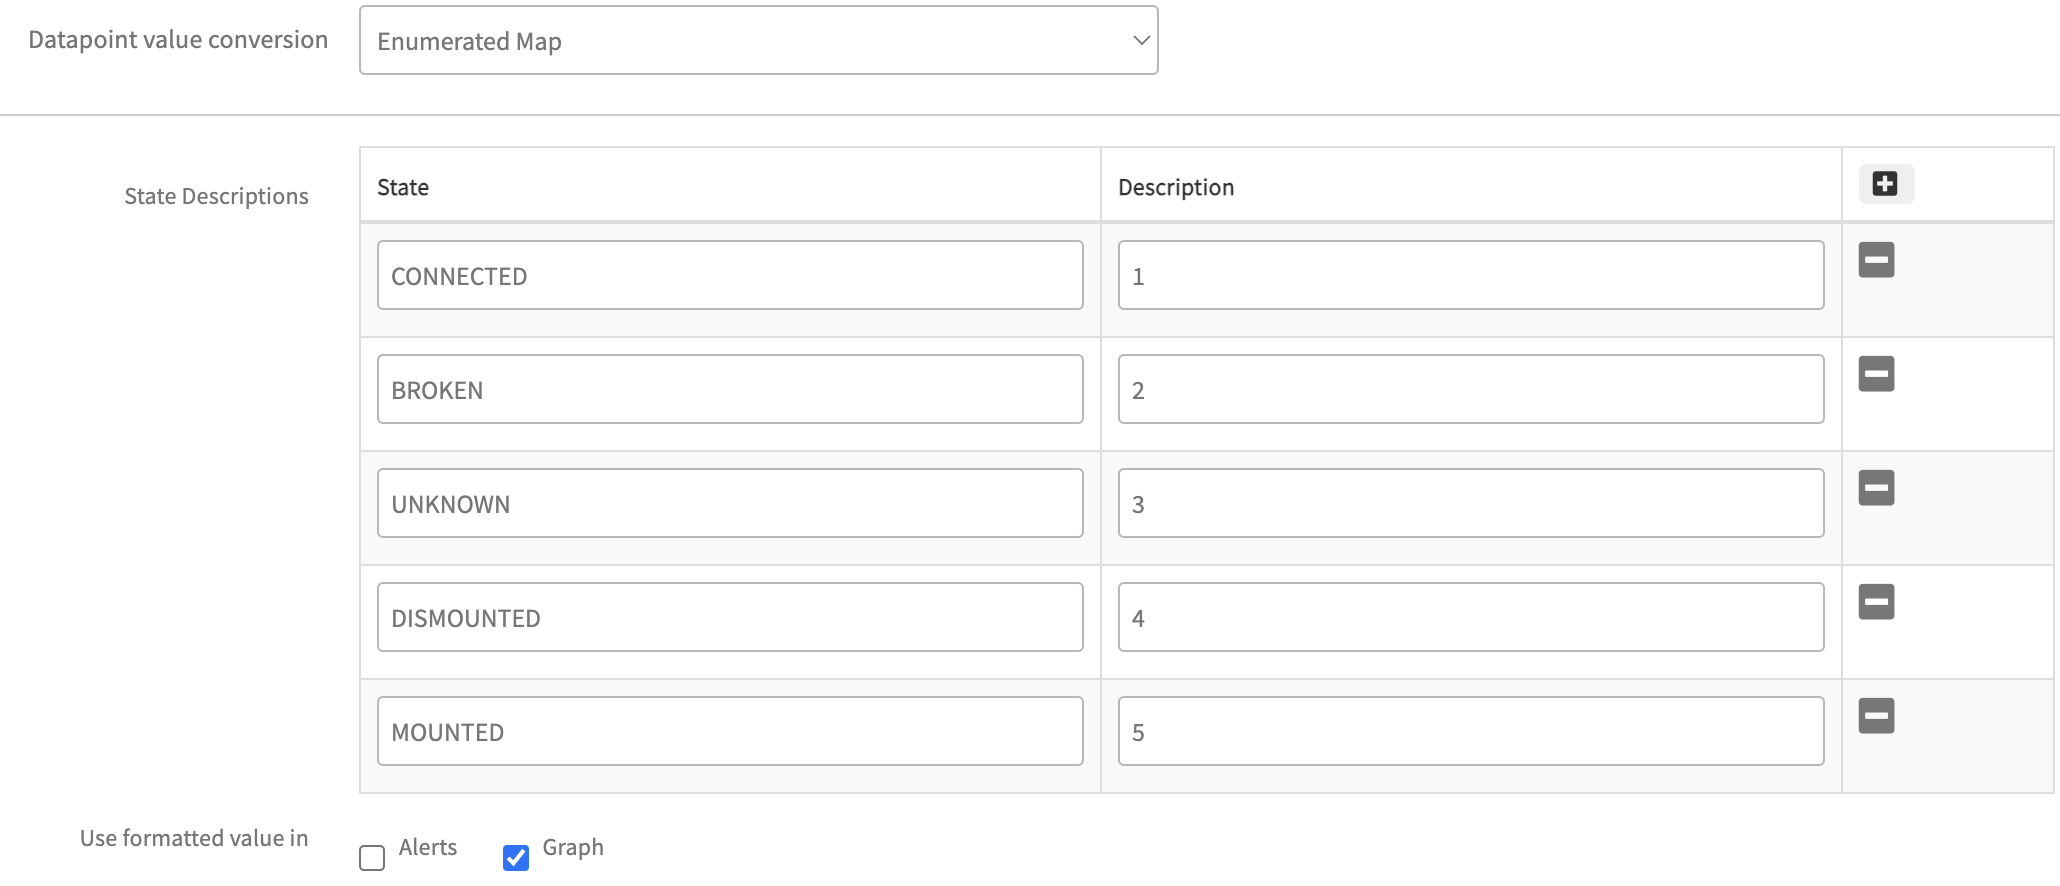
When creating a metric, users must select the Datapoint Value Conversion option as Enumerated Map and provide integer value mappings for each possible state.
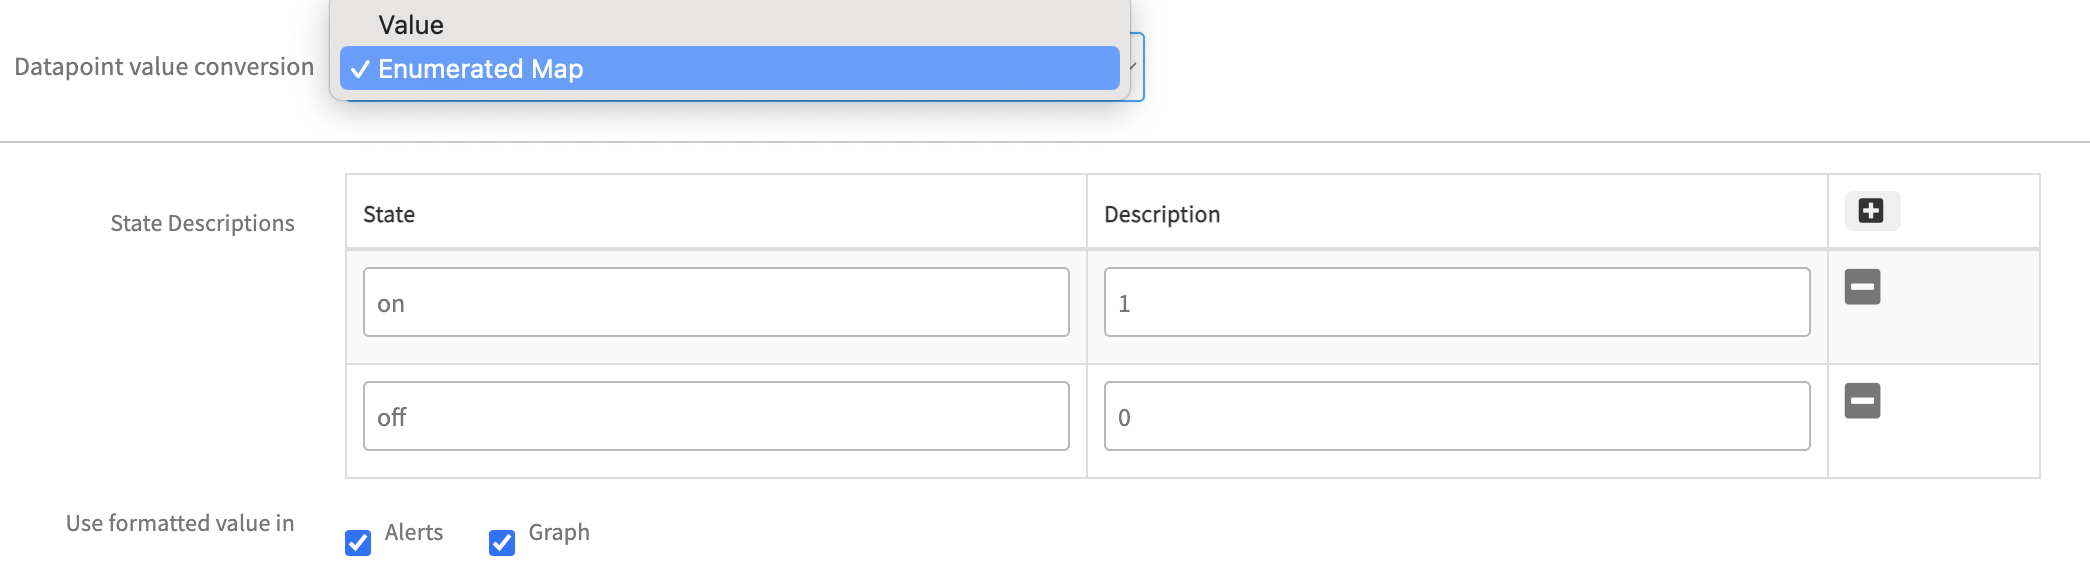
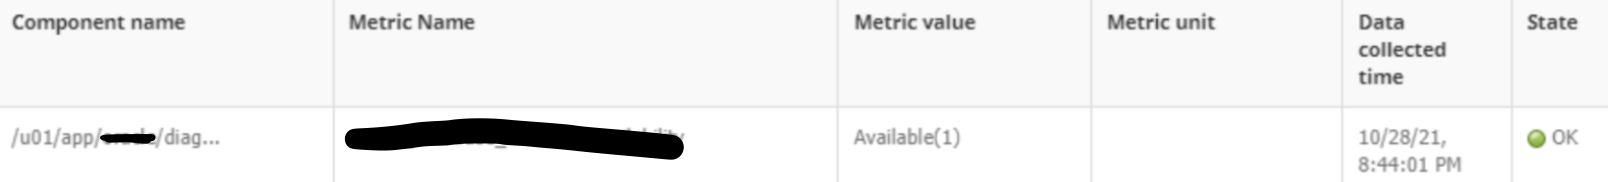
Additionally, there is an option to enable Use formatted value in Alerts & Graphs. If users opt to enable this feature, the enumerated mapping values provided will affect Alerts & Graphs. Otherwise, these values will not be reflected anywhere. Please find below screenshots having enum mapping reflections in monitoring data.
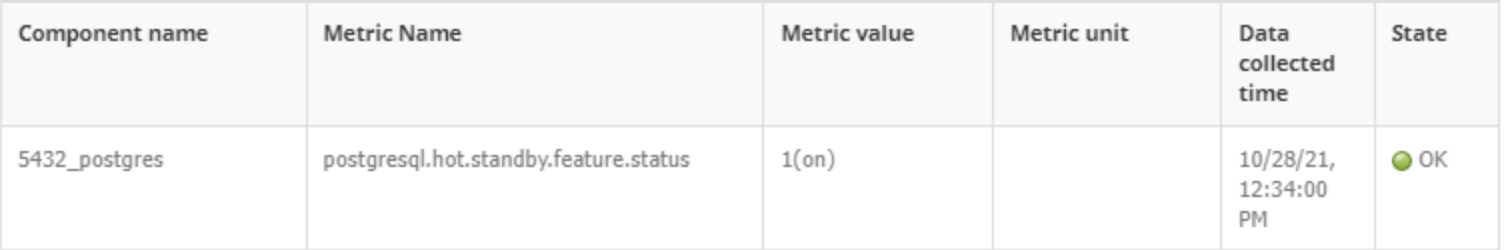
If user provide string value mappings for each possible state (i.e. integer-type values to string-type values).
This configuration will be reflected in monitoring.
Alerting:
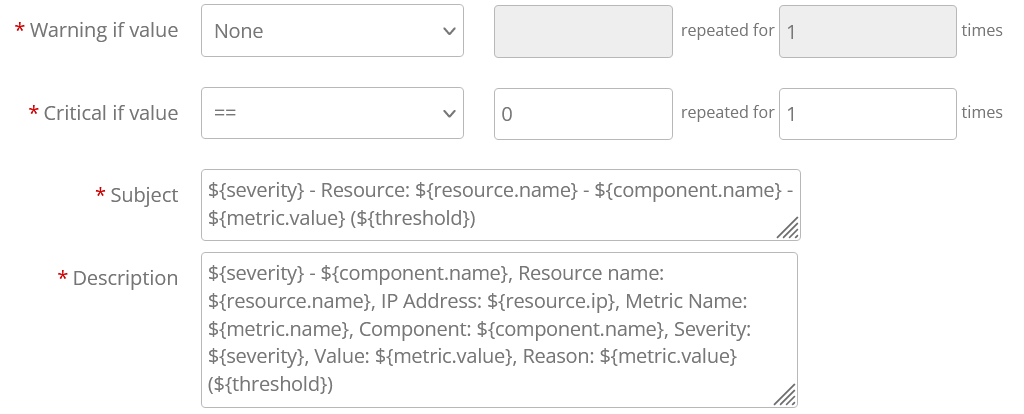
When a metric includes an enumerated map, follow these steps to define critical and warning alert conditions:
As outlined above, the prepared query returns the metric value as a string. To support alert configuration, users must define an enumerated map that assigns each possible string value to a unique integer.
To enable critical or warning alerts, users must identify all string-type values returned by the query and map them accordingly.
Refer to the following screenshot for guidance on configuring critical alerts when the enumerated map (string-to-integer conversion) is enabled.
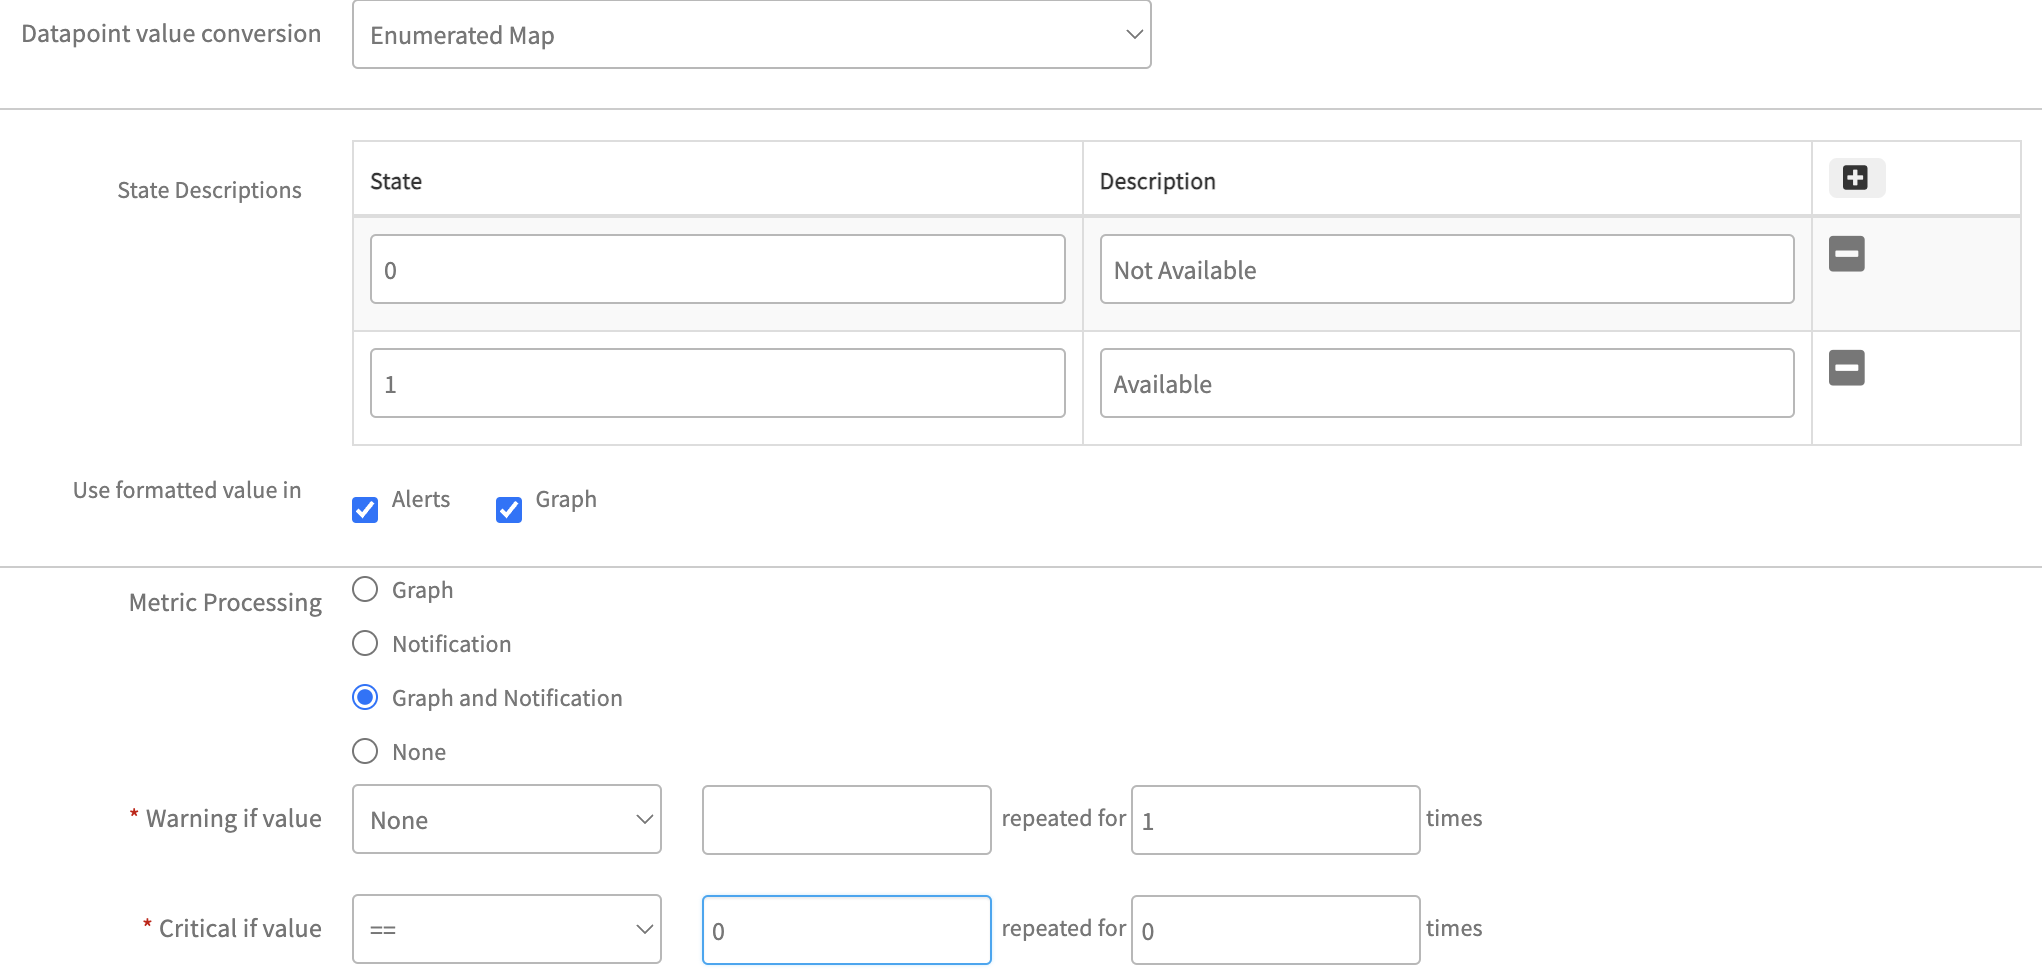
- Refer to the following screenshot for guidance on enabling critical alerts if the enumerated map (integer type to string type) is enabled.
How to create PostgresSQL Metric
Perform the following steps to create PostgreSQL metric.
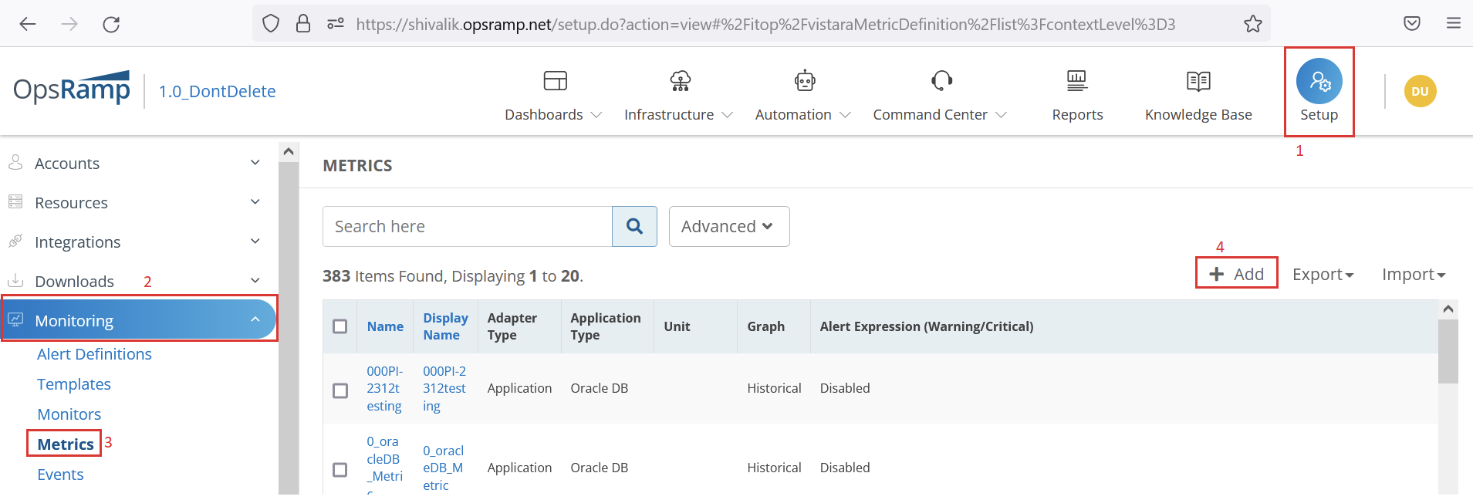
Login to OpsRamp platform and Click on Setup from top menu and expand Monitoring from the side bar menu and click on Metrics.
Click + Add to create a new metric.
Configure the following steps on the Create Metric screen.
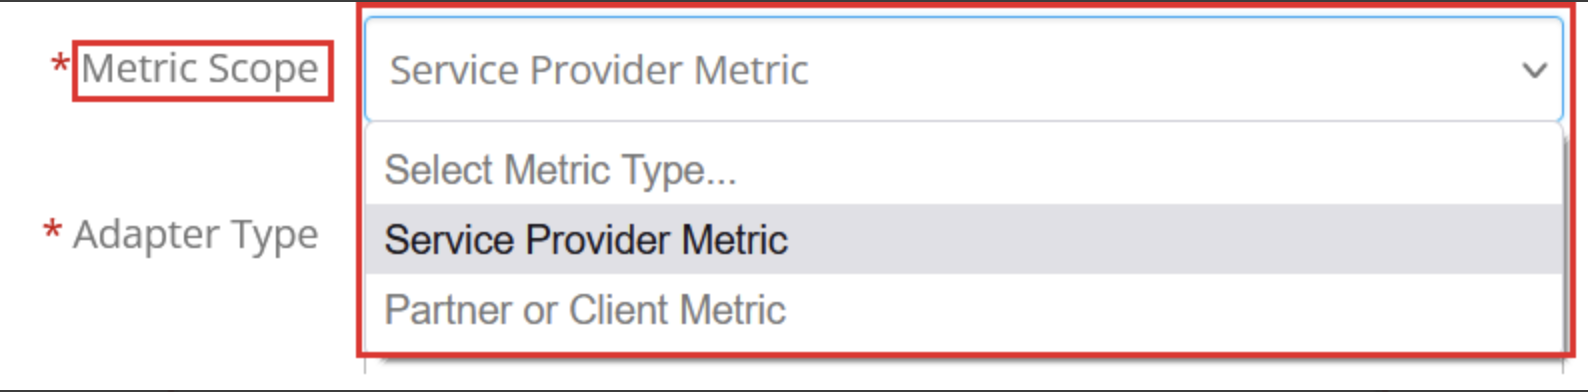
- Metric Scope: Select Service Provider Metric or Partner or Client Metric. Your access level and role may affect how this menu appears. If you select Partner or Client Metric, choose a Partner or Client from the dropdown. The list updates dynamically based on context.
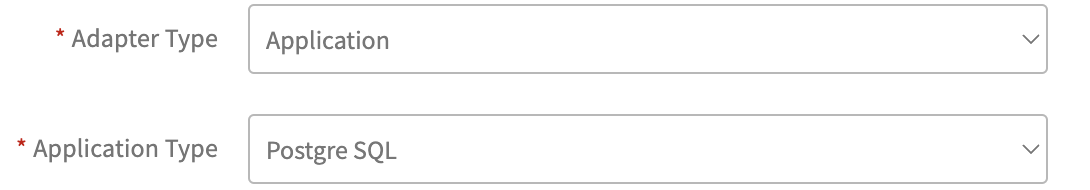
Adapter Type: Select Application from this dropdown.
Application Type: Select Postgres SQL from this dropdown.
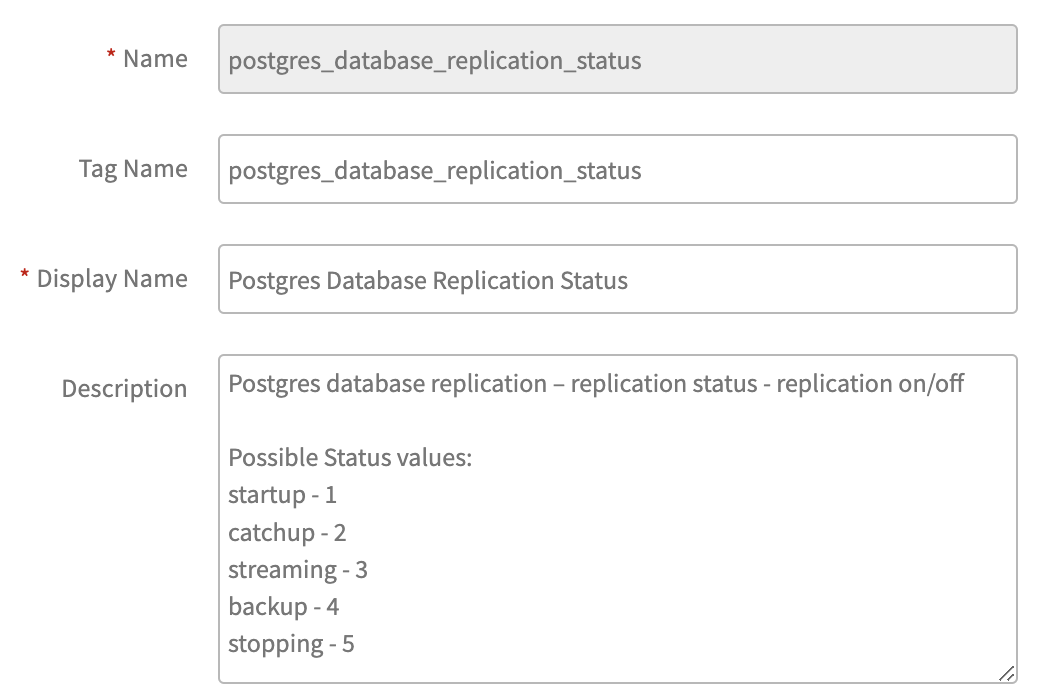
Name: Provide a meaningful metric name.
Tag Name: It is filled automatically with the same metric name.
Display Name: Provide a meaningful metric display name.
Description: Provide description about the metric.
SQL Query: Provide the prepared PostgreSql query. (Note - No need to provide semicolon at the end of the query).
Data Point type: Choose a suitable type from this dropdown. It has the following 8 pre-defined types. For this example, will go with “Gauge”
Counter Delta - It calculates delta on top of metric value.
Counter Delta = (Current poll value - Prev poll value)
Note: If the result is less than zero then it returns zero.
Counter Rate - It calculates rate on top of metric value.
Counter Rate = (Current poll value - Prev poll value) / (Current poll time - Prev poll time)
Note: If the result is less than zero then it returns zero.
Derive Delta - Not related to RSE. No support in both agent and gateway.
Derive Rate - Not related to RSE. No support in both agent and gateway.
Gauge - It returns direct metric value, which is returning from the script.
Rate - It calculates rate on top of metric value.
Rate = (Current poll value - Prev poll value) / (Current poll time - Prev poll time)
Note: If the result is less than zero then it returns negative value.
Delta - It calculates delta on top of metric value.
Delta = (Current poll value - Prev poll value)
Note: If the result is less than zero then it returns negative value.
None - Same as Gauge
Units: Choose a suitable unit from the dropdown. For status-related metrics, units are not required, select None and proceed.
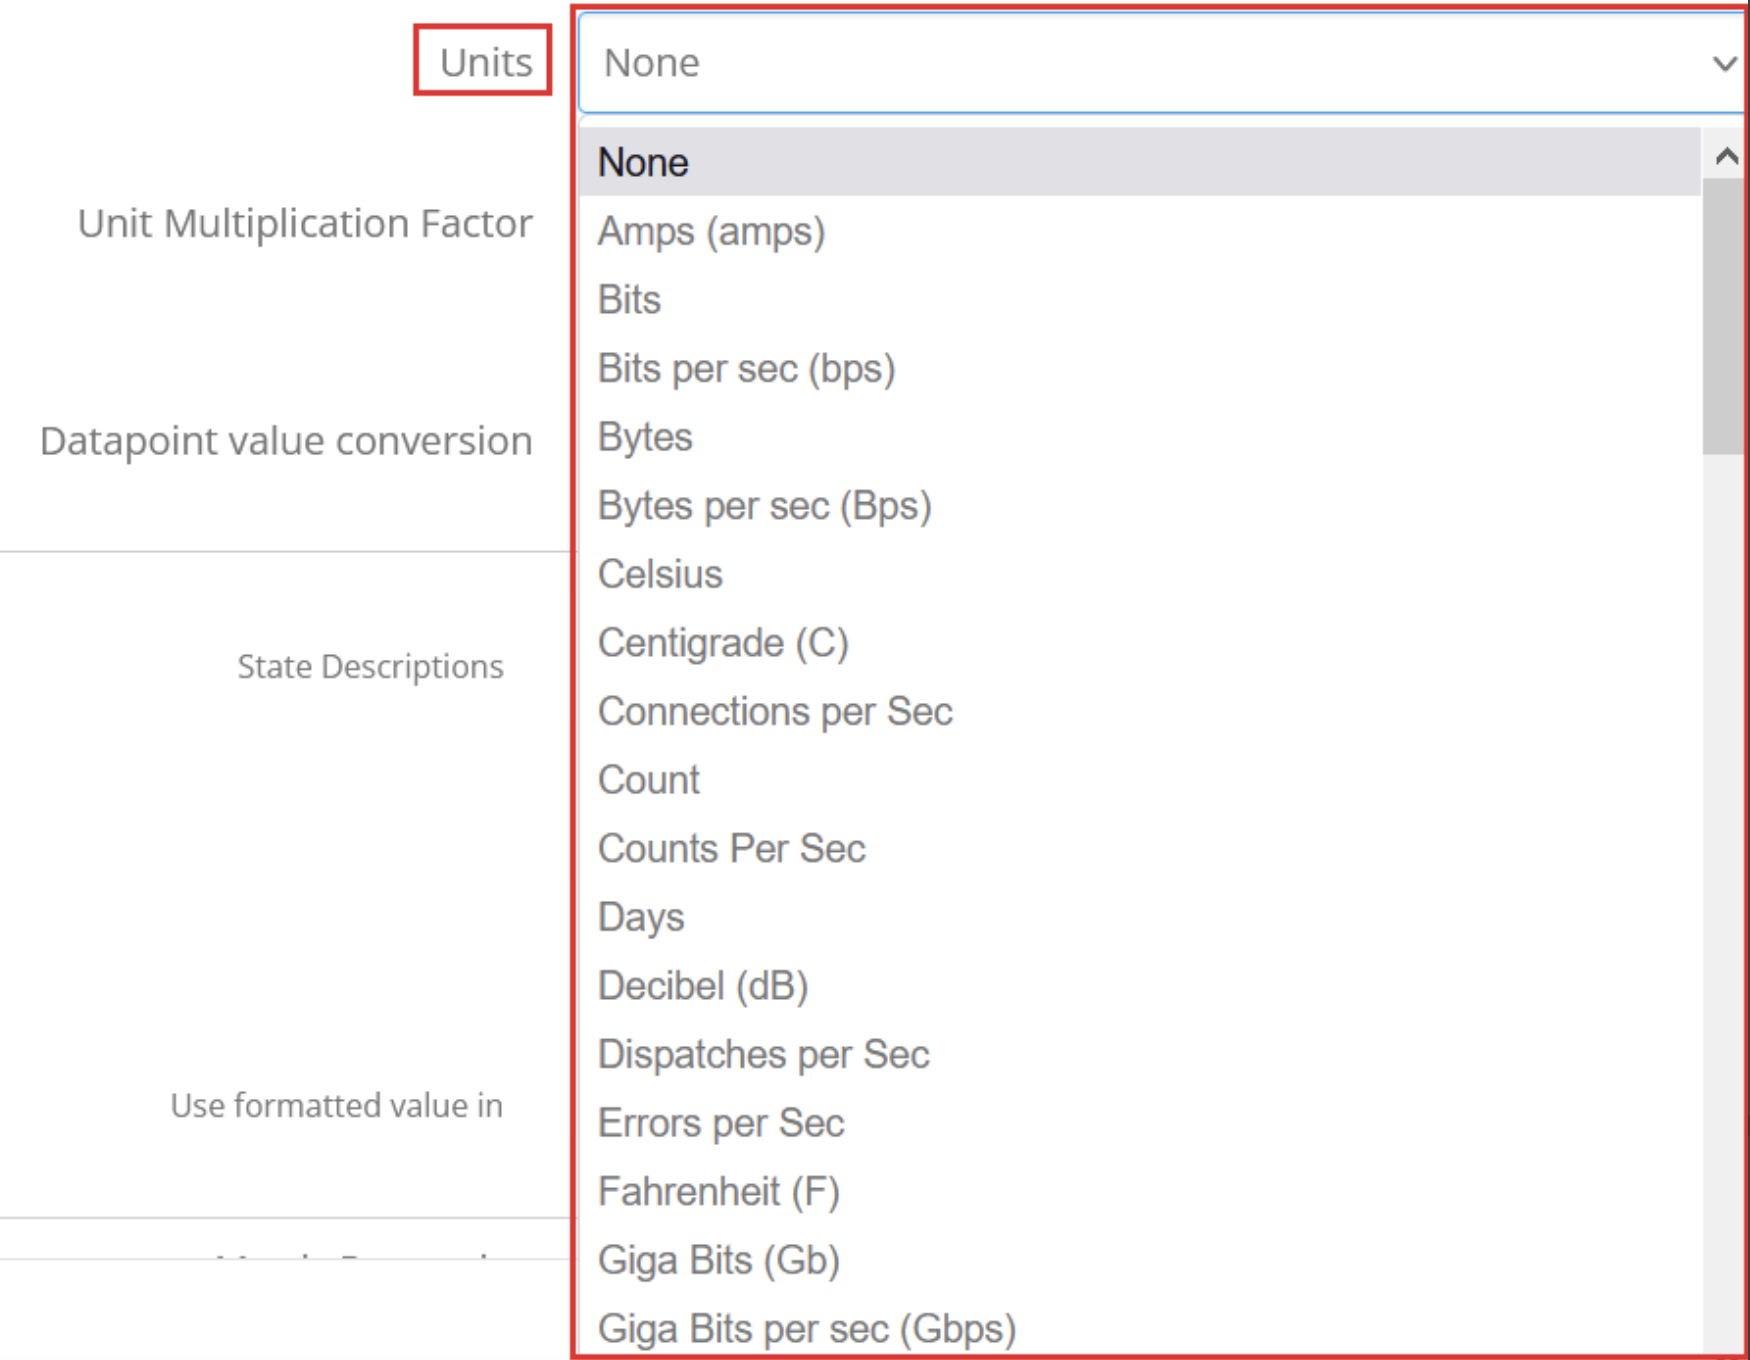
Unit Multiplication Factor: Value to multiply the metric by. As this is status monitor, it doesn’t required this factor value. Select the default value 1.0.

Datapoint value conversion: Choose a suitable option from any of the following.
Value= Choose this option (As shown in below) when no conversion required on the metric value. This is the default value for Datapoint value conversion dropdown.
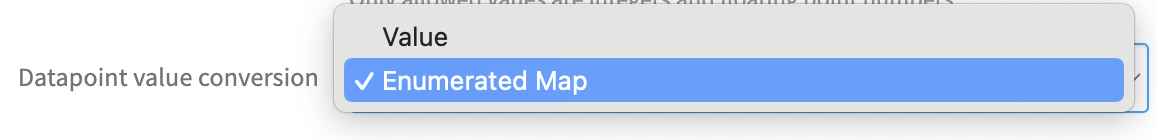
Enumerated Map= Choose this option when enumeration based conversion is required.
For status-related metrics, queries often return string-type values. However, monitoring graphs support only integer values. To ensure compatibility, users must define mappings that convert each possible string value into a corresponding integer.
Sometimes If the query returns direct integer values to the metric but still the user wants to enable enumerated mapping then provide an enumerated map in reverse order. In this case the mapped strings displayed in the metric graph info page and alerts.
Example:1- Running,0 - StoppedBased on user requirements, select the “Alerts” and “Graph” checkboxes accordingly. When both checkboxes are selected, Graphs as well as Alert subject and details page will display integer values alongside enumeration mappings. Additionally, these mappings will appear in the “Get Latest Metric Value” page against the metric.
Metric Processing: Choose any of the following suitable option based on requirement.
<table border="1" cellpadding="6" cellspacing="0">
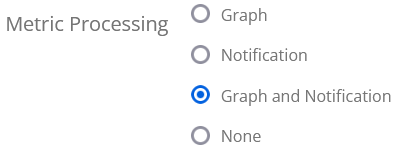
For Notification, Graph and Notification, following options appears.
How to create PostgreSQL Monitor
Follow these steps to create a PostgreSQL monitor:
Log in to the OpsRamp platform and click Setup from the top menu. Expand Monitoring from the sidebar menu and click Monitors.
Click + Add to create a new monitor.
Configure the following steps on the Create A Monitor screen:
Monitor Scope: Select Service Provider Monitor or Partner or Client Monitor. Your access level and role may affect how this menu appears. If you select Partner or Client Monitor, choose a Partner or Client from the dropdown. The list updates dynamically based on context.
Adapter Type: Select Application from this dropdown.
Application Type: Select POSTGRESQL from this dropdown.
Name: Provide a meaningful monitor name.
Description: Provide a detailed description about this monitor.
Metrics: Click Add and select all the metrics you created in the previous section.
Note
Ensure you select the correct PostgreSQL database metrics.Configuration Parameters: Configure the following default configuration parameters:
collector.application.type: Keep the default value POSTGRESQL.
connection.timeout.ms: Keep the default value 15000 ms. You can increase this value if required, but ensure it stays within the monitor frequency/poll time.
postgresql.service.port: Keep the default value 5432. If your target PostgreSQL environment runs on a different port, change this to the correct port number.
postgresql.service.transport: Select the correct secure/insecure transport type.
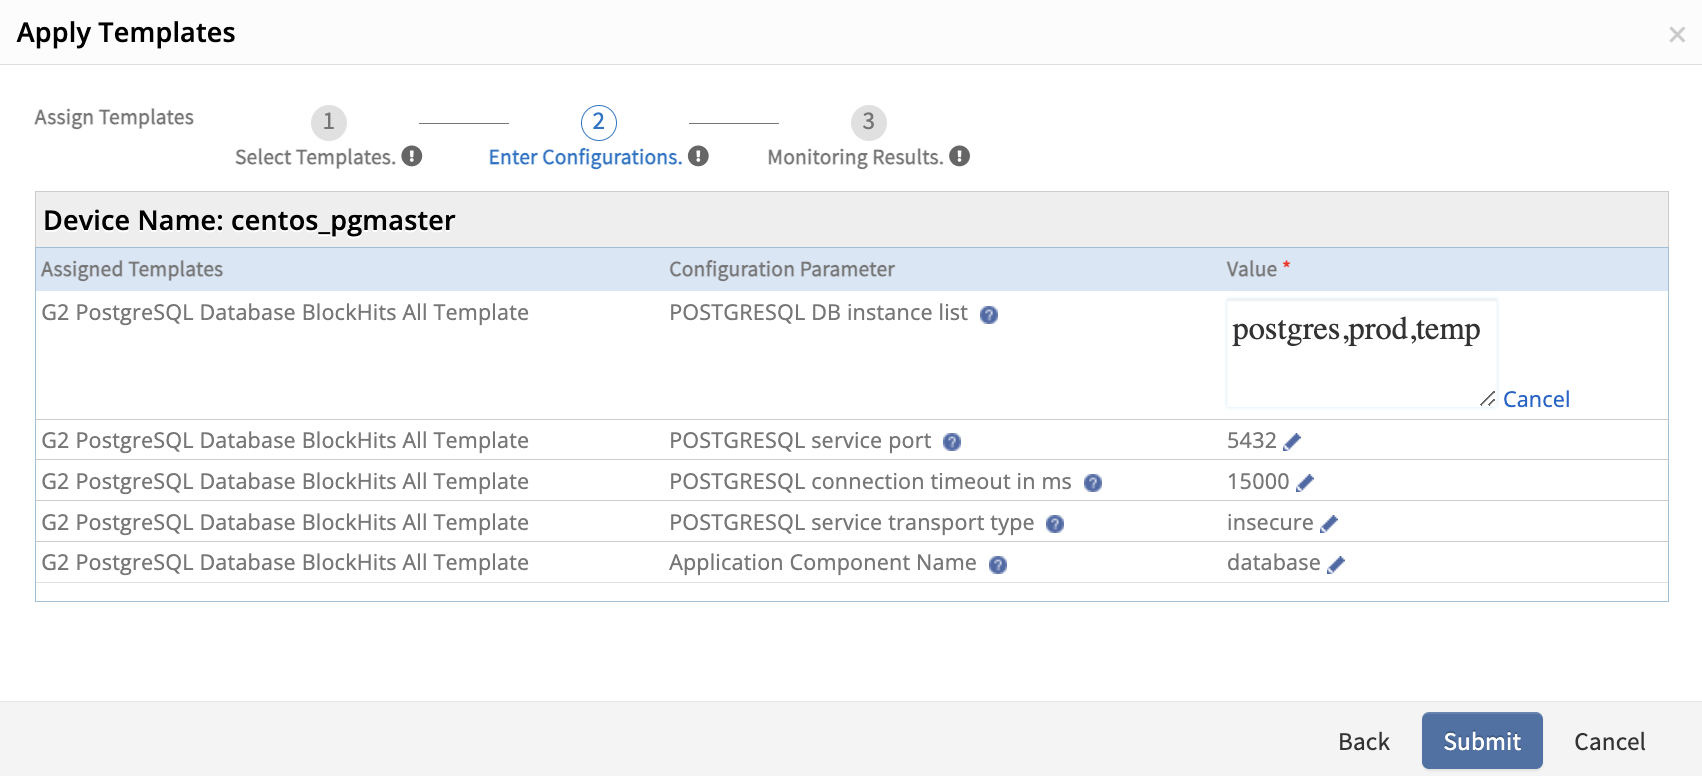
postgresql.dbname.list: Provide the database instance name here:
- If your target PostgreSQL environment has multiple database instances running on the same port, provide input like:
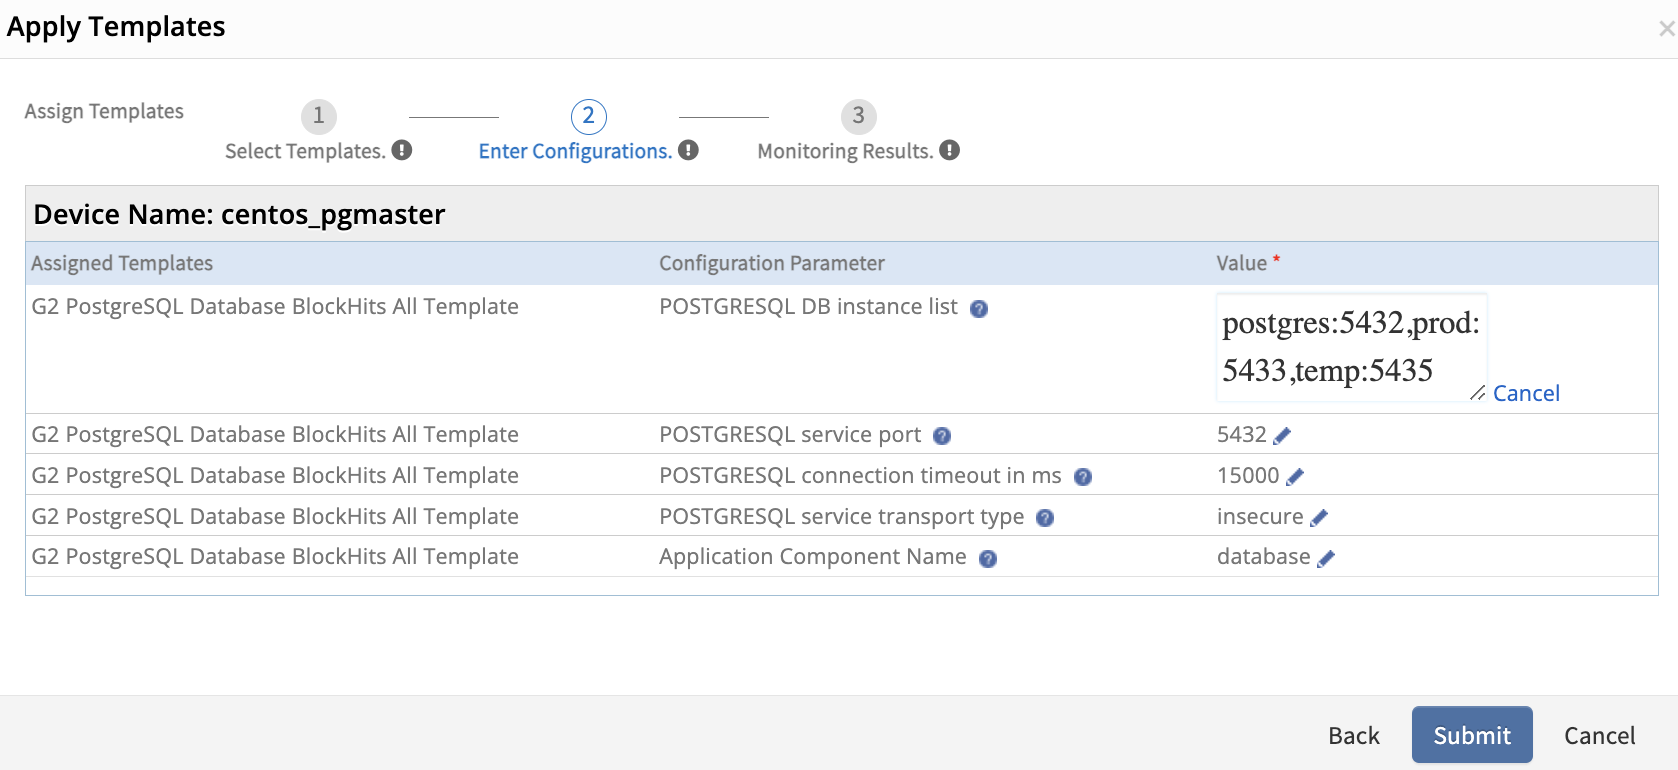
InstanceName1, InstanceName2 - If your target PostgreSQL environment has multiple database instances running on different ports, provide input like:
InstanceName1:Port1, InstanceName2:Port2
- If your target PostgreSQL environment has multiple database instances running on the same port, provide input like:
postgresql.multiinstance.flag: Select Yes or No. If your target PostgreSQL environment has a multi-instance configuration, select Yes. Otherwise, select No.
SSL Monitoring Configuration Parameters: Configure the following SSL parameters:
use.ssl.certificate: Configure the database to use SSL certificate. The default value is No.
postgresql.ssl.mode: Configure SSL mode parameter values that provide different levels of protection. Possible SSL mode values include
verify-ca,verify-full,require,allow,prefer, anddisable. The default SSL mode configuration parameter value isverify-ca.postgresql.root.certificate: Check that the client certificate is signed by a trusted certificate authority. Provide the certificate with the complete path like
/opt/gateway/content/certificates/POSTGRESQL/root.crt.postgresql.ssl.certificate: Provide the client SSL certificate in DER format with the complete path like
/opt/gateway/content/certificates/POSTGRESQL/postgresql.crt.der.postgresql.ssl.certificate.key: Provide the client SSL certificate key in DER format with the complete path like
/opt/gateway/content/certificates/POSTGRESQL/postgresql.key.pk8.
Click Save to create the monitor.
How to create PostgreSQL Database Monitoring Template
Follow these steps to create a PostgreSQL Database Monitoring Template:
Log in to the OpsRamp platform and click Setup from the top menu. Expand Monitoring from the sidebar menu and click Templates.
Click +Add to create a new template.
Configure the following steps on the Monitor Template screen:
Template Scope: Select Service Provider Template or Partner or Client Templates. Your access level and role may affect how this menu appears. If you select Partner or Client Templates, choose a Partner or Client from the contextual dropdown that is dynamically populated.
Collector Type: Choose Gateway.
Note: Database query-based monitoring supports Gateway collector type only.
Monitor Type: For Gateway, select the Monitors radio button.
Applicable For: Always select Device.
Template Name: Provide a meaningful template name.
Description: Provide an elaborate description about this template.
Leave the remaining fields as default and scroll to the bottom. Click +Add against Monitors.
Select Frequency: Select monitoring frequency based on metric requirements.
Monitor Definition: Choose the monitor you created in the previous section.
When To Alert: Proceed with the default option: Breach of a Threshold.
Click Add and then Save to create the template.
Assign templates from setup
Assign PostgreSQL templates to one or more resources for a selected client and change the configuration parameters while assigning templates. For more information, see Assign Templates from Setup.
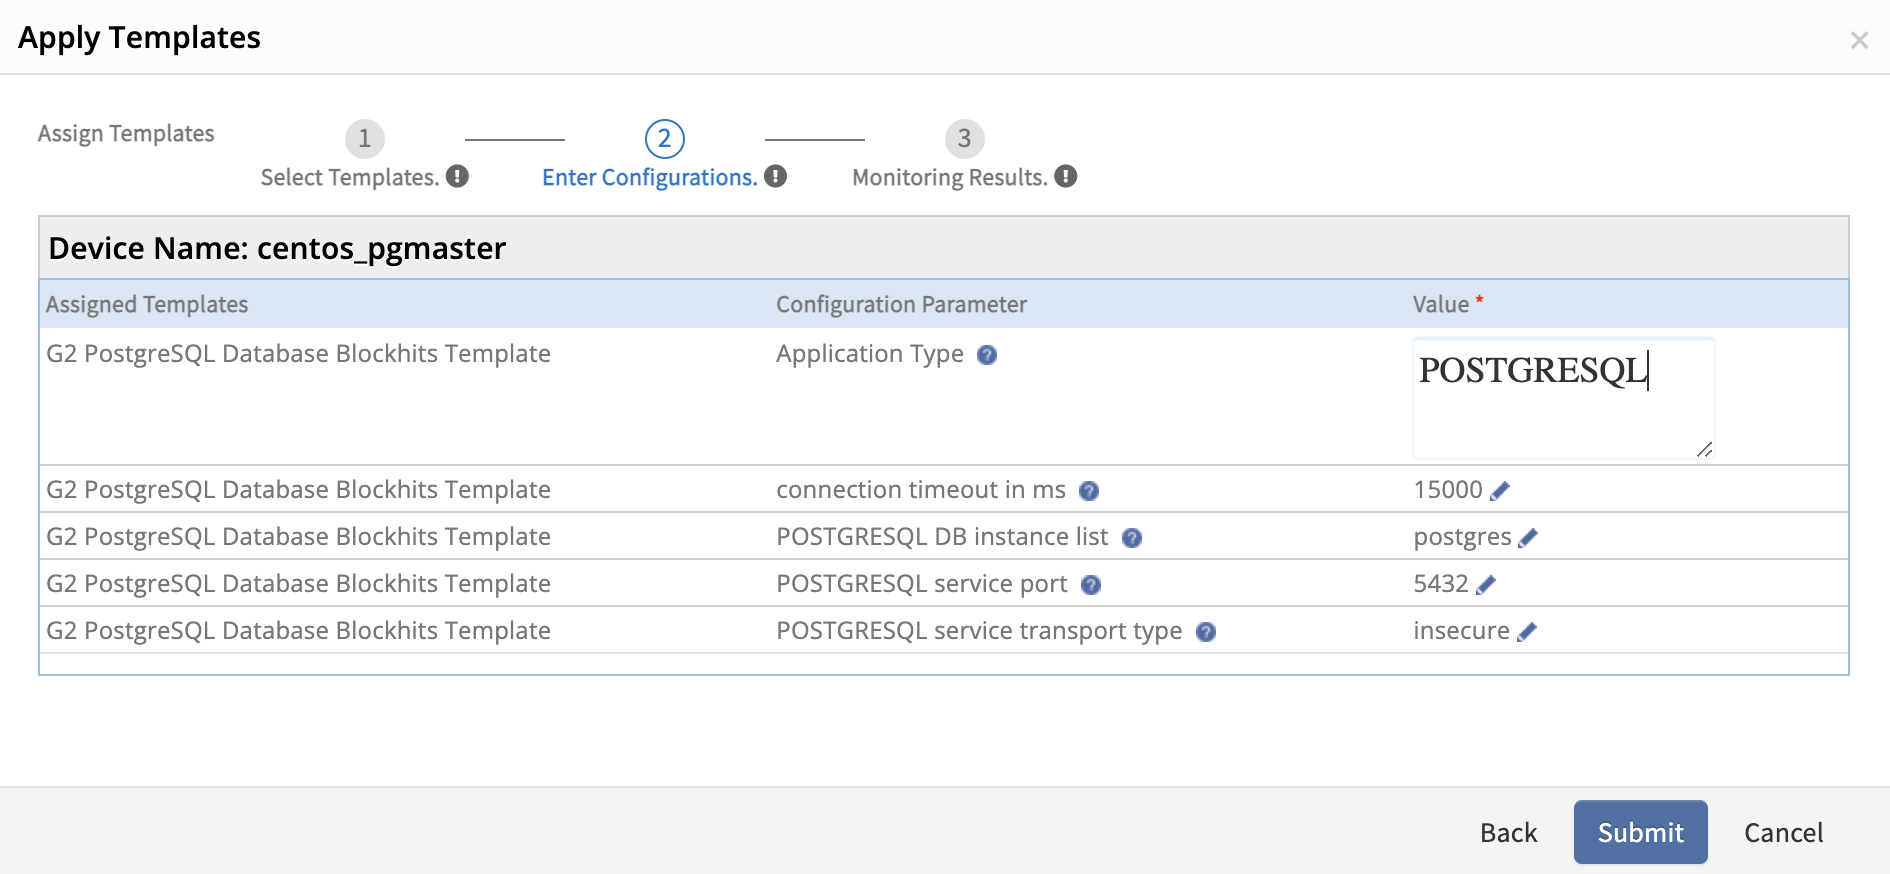
Assign templates at the device level
Applying PostgreSQL templates at the device level helps assign one or more templates to a specific resource. You can change the configuration parameter default values while assigning the templates. For more information, see Assign Templates at the Device Level.
Template configuration parameters:
| Configuration Parameter | Description |
|---|---|
| Connection Time-out | The maximum time to connect to the database. The driver waits for the specified time before timing out due to connection failure. The default time is 6000 milliseconds (ms). |
| Service Transport Type | To configure the database at a secure end-point. The default type is In-secure. The connection is Secure when the data sent between the client and server is encrypted. |
| Service Port | The port number where the database is running. The connection is made to the specified port if you specify the port and the database name. The default port is 5432. |
| DB Instance Name | The name of the database to connect to. The default name is root.
|
| Application Type | The application type value to identify the adapter. For example, POSTGRESQL. Do not change the default application type value. |
Assign template from device management policies
Device management policies help manage resources. You can assign monitoring templates, knowledge base articles, and custom attributes using device management policies. The device management policy can be applied to one or a set of resources. For more information, see Creating Policies.
Configure parameters based on your PostgreSQL configuration. The system displays default parameters by default, as shown below.
Multiple instances running on same DB port.
Multiple instances running on different DB ports.
How to update and Add Metrics to Monitor & Monitor to Template
Follow these instructions to update metrics, monitors, and templates. Otherwise, changes will not reflect on the target machine.
Update Metrics
To update a query, description, units, enumerated map, and alert tokens in a metric (Note: Metric Name remains unchanged) that belongs to a template, follow this process:
Navigate to Setup > Monitoring > Metrics, open the specific metric, and then:
- Update and save the metric.
- Open the monitor, reload the updated metric, and save the monitor.
- Open the template, re-add the updated monitor, and save the template.
- Assign the template to resources directly or via DMP to view the updated metric changes in the resources.
Update Monitors
To update a monitor by adding/removing metrics, updating description and configuration parameters that belong to a template, follow this process:
Navigate to Setup > Monitoring > Monitors, open the specific monitor, and then:
- Update and save the monitor.
- Open the template, re-add the updated monitor, and save the template.
- Assign the template to resources directly or via DMP to view the updated metric changes in the resources.
View resource metrics
The gateway monitors the application using the assigned templates and displays the results in graphical format. To view resource metrics, click the database resource name > resource Details > Metrics.
Points to be considered
- Gateway collector type only supports PostgreSQL query-based monitoring.
- Assign the correct PostgreSQL database credentials (with proper privileges to execute metric queries) on the target PostgreSQL server.
- Ensure the PostgreSQL DB port is accessible via telnet from the Gateway. Refer to Step 2 - Check database server IP address & port connectivity.
- If you use instance-level authentication, assign all credential sets on the target PostgreSQL server. OpsRamp Gateway will handle connections to different PostgreSQL server instances.
- Provide the correct transport type (secure or insecure).
- When preparing PostgreSQL queries, avoid using frequently changed fields as component names (such as Postgres session names, userNames, etc.) or any combinations (such as databaseName_sessionId, tableName+userId, etc.).
- When database connectivity issues occur from the Gateway, the Framework generates alerts such as ‘postgresql.auth.error.’ However, it does not generate alerts for query syntax errors, empty data, or access denied issues.
Troubleshooting Steps
Use case 1 - Failed to get latest metric values/Gateway is offline
When you apply PostgreSQL monitoring templates on devices and encounter the message “Failed to get latest metric values/Gateway is offline” while fetching latest metric data, follow the steps below:
Step 1: Navigate to the Overview section of the Device (Infrastructure » Resources » Search using IP or Device Name) and ensure that the Gateway is online (indicated by blue color).
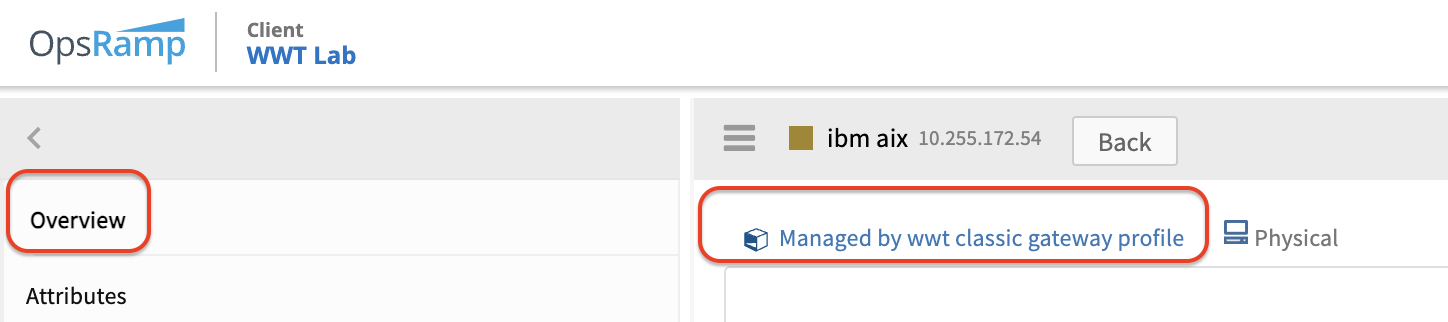
Step 2: Identify whether a template is global or customer written.
To determine if a template is global or custom-written, refer to “How to identify whether a template is global or customer written.”
Step 3: Review any alerts associated with the template on the Overview page of the Device or navigate to Command Center » Alerts page and filter using the specific server name or IP address. We use a static alert format with the metricName postgresql.auth.error and the component name like <instanceName>.

Step 4: Check key points related to PostgreSQL monitoring. Refer to “Points to be considered.”
Step 5: Access Gateway
You can access the gateway using the following two methods:
- Log in to the gateway using SSH.
ssh username@gateway-ip
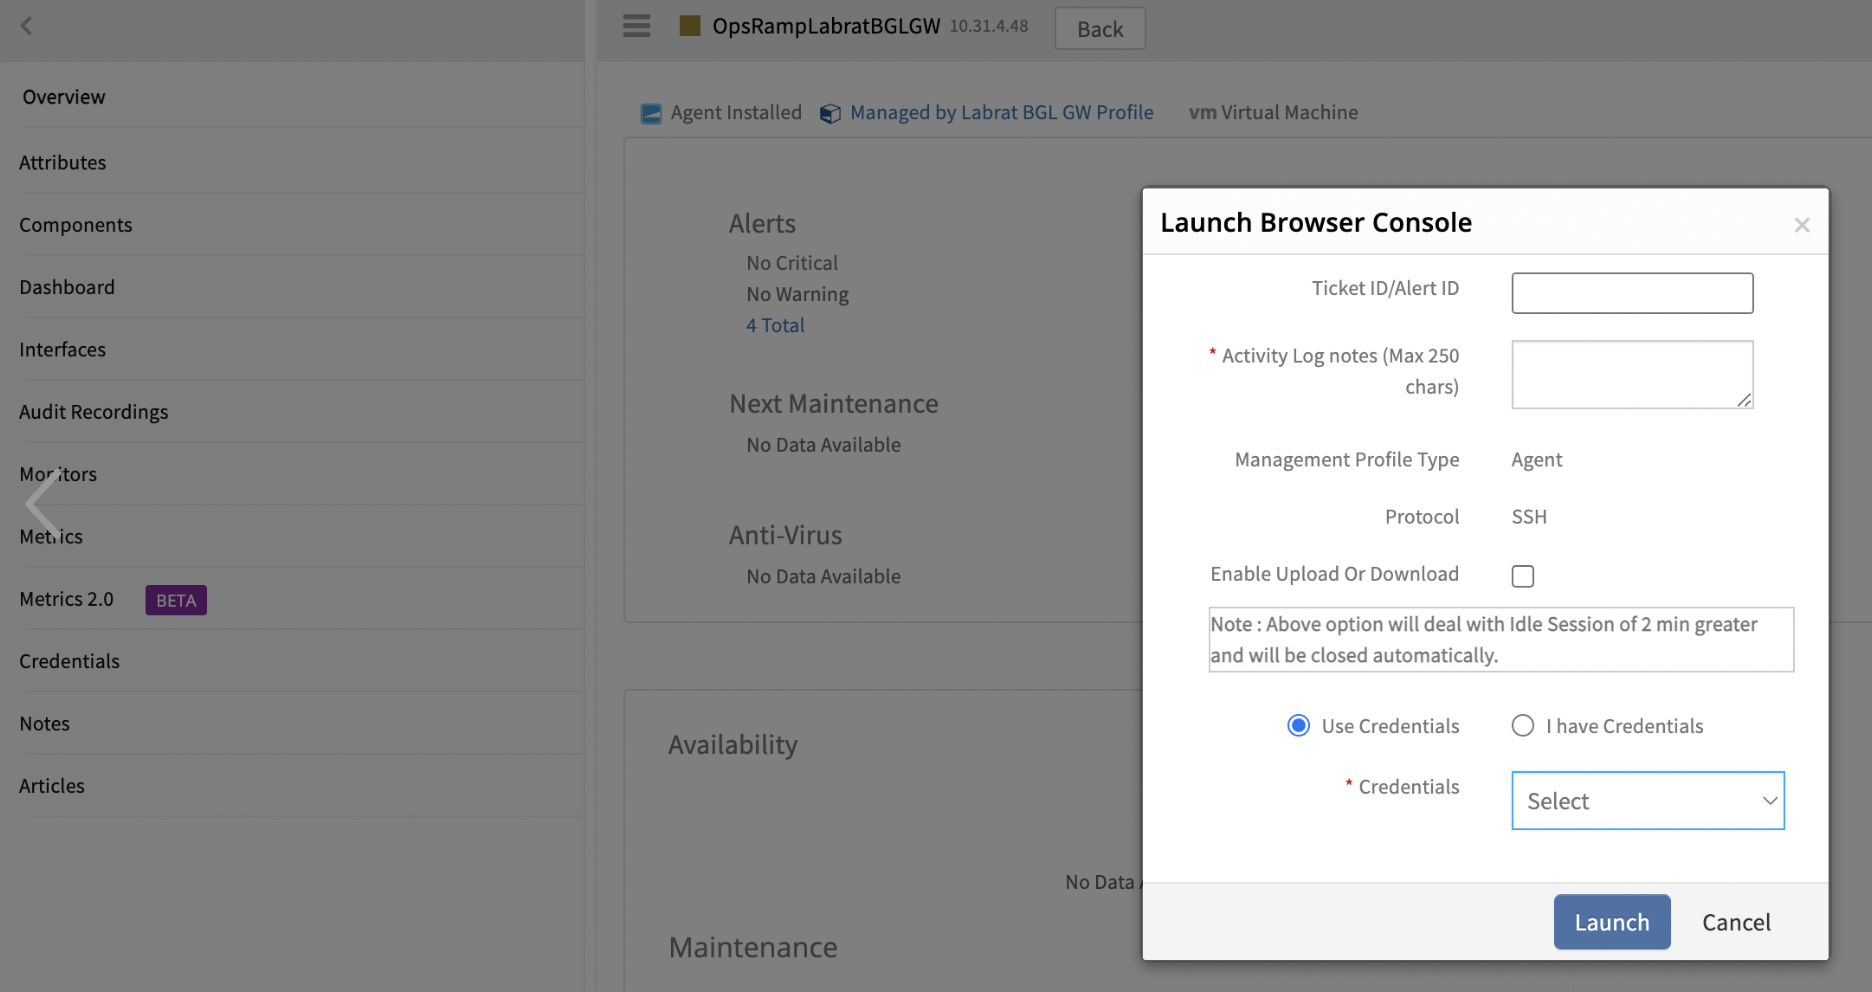
- Log in to the gateway using browser console.
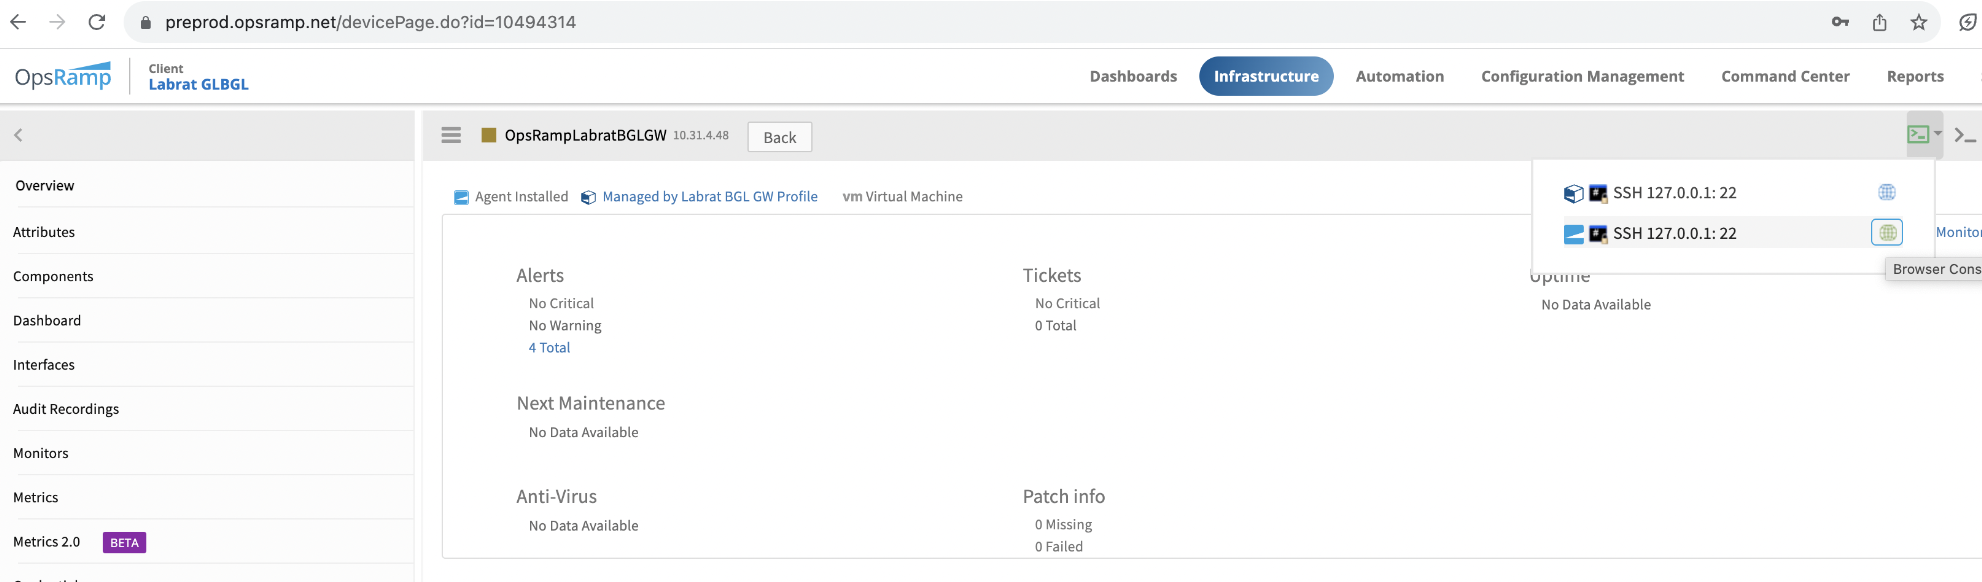
Click on the browser console, which will redirect you to the following page. Provide the necessary fields and launch the console.
Step 6: Check database server IP address & port connectivity.
Log in to the gateway (Refer to Step 5: Access gateway).
Type
ping <ipaddress>and click enter, then runtelnet <ipaddress> <port>.
Step 7: Connect to GCLI terminal in gateway.
Classic Gateway:
Log in to the gateway (Refer to Step 5: Access gateway).
Type
gcliand click enter to open the gcli terminal.
Nextgen Gateway:
Log in to the gateway (Refer to Step 5: Access gateway).
Execute command
kubectl exec -it nextgen-gw-0 -c vprobe -n <namespace> -- bash.
Note: Replace the kubectl exec -it nextgen-gw-0 -c vprobe -- bash.
- Type
gcliand click enter to open the gcli terminal.
Step 8: Access PostgreSQL logs.
By default, the OpsRamp gateway captures few error logs. If you want to enable all available logs related to PostgreSQL DB, follow these steps:
- Access gcli mode by running:
gcli(Refer to Step 7: Connect to GCLI terminal in gateway). - Use this command to enable debug logs:
flag add postgresql.log on 30. - Exit gcli prompt and run this command to observe logs:
sudo tail -100f /var/log/app/vprobe.log. - In Nextgen Gateway, if you want to copy files from the vprobe container to the gateway cli, execute the following command after exiting the container:
kubectl cp <namespace>/nextgen-gw-0:<source_path> <dest_path> -c vprobeExample:kubectl cp nextgen-gw-0:/var/log/app/vprobe.log /home/gateway-admin/vprobe.log -c vprobeDownload files from the gateway cli.
Step 9: Execute PostgreSQL query manually from the GCLI on the target machine.
- Access gcli mode by running:
gcli(Refer to Step 7: Connect to GCLI terminal in gateway) - Execute PostgreSQL query via gcli prompt:
Syntax of the command:
db postgresql <Ipaddress> <username> <password> <port> <SID/ServiceName> 15000 10000 insecure <Yes/No> <"Query">
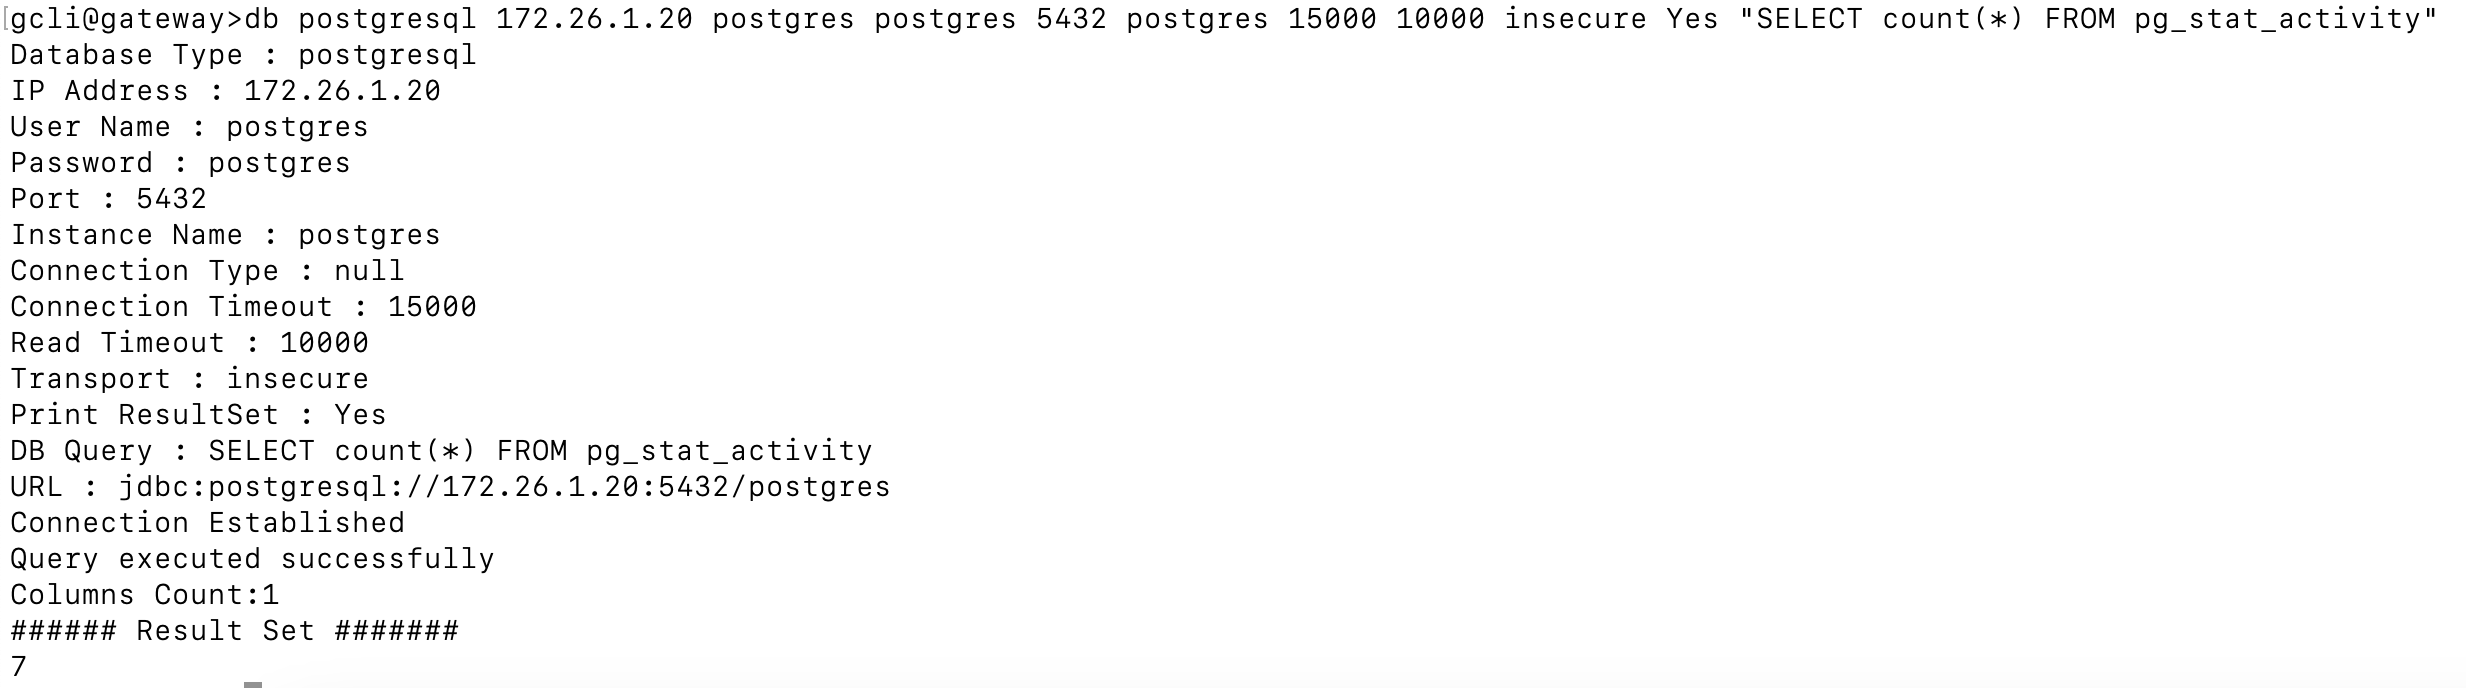
If the query output returns more than 2 columns, refer to “How to Prepare PostgreSQL metric query.” If manual query execution returns any PostgreSQL exceptions, refer to “PostgreSQL Exceptions.”
Step 10: If you cannot determine the root cause of the issue from the logs or query output, or if different exceptions occur when executing a PostgreSQL query, raise a case and attach the relevant logs and manual query output.
Use case 2 - Graph data is not populating for specific or all metrics
Step 1: Validate whether the metric retrieves data from the end device by checking latest snapshot data. If not, refer to Use case 1 - Failed to get latest metric values (or) Gateway is offline.
Step 2: Check if the graph is enabled at the metric level. If enabled, verify whether the data from latest snapshot data is a string.
If it’s a string, check if Enum Mapping is defined for that string at the metric level.
Step 3: If Enum mapping is not defined for that particular string and it’s a global template, raise a case while attaching screenshots of latest snapshot data and Enum Mapping defined at Metric.
Step 4: If Enum mapping is not defined for that particular string and it’s a customer written template, suggest the customer edit the metric and add this new state in the State Descriptions field. Also refer to “How to handle enum mappings & Alerting.”
Use case 3 - User observes gaps in metric graphs
This issue might occur due to the following reasons:
- Gateway goes offline at that time
- The device is not reachable and port connectivity issues occur
- No data is available for the metric on the device at that time
Check the debug level logs to verify if Gateway was offline at that time.
If you do not find any logs related to those issues, raise a case while attaching logs to analyze query output at those specific times when the graph is not populating.
Use case 4 - Alerts not getting generated on resource for particular metric
Check latest snapshot data to see if we retrieve any data from the device for that metric and verify the thresholds defined for the metric.
If the latest snapshot data is also not coming for that metric, execute the command or script manually on the device to see if any data exists for that metric.
Use case 5 - Alerts generated do not align with the defined alert thresholds
Refer to the Alerts Hierarchy outlined below:
Alert Thresholds Precedence Order: Template level threshold > Device level threshold > Component level threshold
Alert thresholds follow a hierarchical order, starting from the component level and moving up to the template level. Each level can override the thresholds set at the previous level. Component-level settings override those set at the device level, and device-level settings take precedence over template-level settings.
This hierarchy ensures that monitoring configurations can be finely tuned at various levels of the system, allowing for granular control over alerting parameters. This approach enables more precise and effective management of alerts tailored to the specific needs of each level.
FAQs
Why is latest snapshot data not available?
Refer to Use case 1 - Failed to get latest metric values / Gateway is offline
Why are graphs not reflecting?
Check “Points to be considered” & Use case 2 - Graph data is not populating for specific or all metrics
Why is postgresql.auth.error alert generated?
Refer to Use case 1 - Failed to get latest metric values / Gateway is offline
What are the possible PostgreSQL exceptions?
Below are few possible exceptions while connecting to PostgreSQL server:
- password authentication failed for user ‘username’
- database “database_name” does not exist
- The server was not found or was not accessible
- Timeout and Socket Exceptions
- The connection attempt failed
- The connection is already open or closed
Note: These exceptions may occur while manually executing PostgreSQL queries via Gateway GCLI prompt
To resolve these types of issues, request the user to try the following solutions:
- Check whether the PostgreSQL database instance is up and running
- Ensure the PostgreSQL server is configured to accept remote connections, and verify the necessary services are running
- Verify that firewall rules allow traffic on the PostgreSQL port (default is 5432)
- Ensure the user has the necessary permissions to access the database and execute queries
- Check PostgreSQL logs and system logs for more detailed error information
- Refer to “Points to be considered”
Where can I check OpsRamp supported PostgreSQL Metrics?
Check the Recommended Templates page within the public documentation.
Refer to this link - PostgreSQL Metrics
If the required monitoring support is not found on these pages and it’s a generic request applicable beyond the customer’s specific needs, submit a case to the support team for Request for Enhancement (RFE).
However, if the monitoring requirement is specific to the customer’s needs, customers need to develop their own script by following this documentation.
How do I identify whether a template is global or customer written?
The details available in the links below only pertain to Global Templates and Metrics. PostgreSQL Metrics
If latest metric snapshot data is not coming from the template, refer to Use case 1 - Failed to get latest metric values / Gateway is offline.
What steps should a user follow if they want to create their own query-based custom metric for database monitoring?
Users can refer to the Create Custom Metrics guide available in the public documentation.
This guide provides comprehensive instructions on how to develop query-based custom metrics.
Refer: https://docs.opsramp.com/solutions/monitors/database-monitors/postgresql/#create-custom-metrics
The above documentation is for query-based PostgreSQL monitoring. Similarly, if they want to create custom metrics for MySQL, MSSQL, or Oracle, customers should select the corresponding Application type (MySQL, MSSQL, or Oracle) during the metric creation process.
Can customers create query-based metrics using Agent collector type?
No, Query-based metrics only work with collector type Gateway, not with Agent.
How do I plot graphs for string values like health or status metrics?
To plot graphs for state or status-related metrics returned as strings, utilize the Enum Mapping option. Refer to “How to handle enum mappings & Alerting.”
Why are metrics and monitor changes not getting reflected in template (latest metric data or graphs or alerts)?
Refer to “How to update & add metrics to Monitor & Monitor to template.”
User wants to exclude monitoring for some components of metric. How can they achieve this?
If a user wants to exclude monitoring for some components of a metric, suggest they use the Component Filters option of RSE.
By using these component filters, you can monitor specific components or ignore unwanted components from monitoring.
Refer to this documentation on how to use RSE Component Filters: https://docs.opsramp.com/solutions/monitoring/template/component-filters/
For PostgreSQL monitoring, should SSH credentials be assigned on the target device or on the Gateway device?
In PostgreSQL monitoring, you do not need to assign SSH login credentials on the target device or on the Gateway device.
Authentication error alerts (Database Related) observed on device Overview page
If it’s a PostgreSQL query-based template, ensure that PostgreSQL Database Type credentials are assigned in the device’s credentials tab.
Observed any PostgreSQL Query execution errors on device like permissions error
Assigned Database Type credentials must have sufficient permissions to execute the query on the device.
User wants to know the queries used for template
Go to the Setup page → Navigate to Monitoring → Click on Metrics → Search the exact metric based on scope → Open the metric definition → Monitoring query available on the metric definition
Can a user assign version 1 and version 2, 3, 4 etc of a template on the same device?
No, users cannot assign version 1 and version 2, 3, 4, etc., of a template to the same device simultaneously. In nearly all cases, the metrics present in version 1 (v1) will also be included in version 2 (v2) or later versions. The later versions typically include additional metrics, enhancements to existing metrics or methodologies, and bug fixes. Therefore, we recommend always using the latest version of the template to ensure that users benefit from these improvements and new features.
Supported templates
If multi-instance monitoring support is needed, you need to create monitor and template copies. This is a mandatory requirement for all multi-instance templates.
| Collector Type | Template Name |
|---|---|
| Agent | Linux - PostgreSQL Monitors |
| PostgreSQL Status and Performance Check | |
| Gateway | Advanced Cloud Database Template for PostgreSQL |
| Advanced Cloud PostgreSQL Database BlockHits Template | |
| Advanced Cloud PostgreSQL Database Connection Statistics Template | |
| Advanced Cloud PostgreSQL Database Cpu Utilization Template | |
| Advanced Cloud PostgreSQL Database Deadlocks Template | |
| Advanced Cloud PostgreSQL Database Disk Usage Template | |
| Advanced Cloud PostgreSQL Database IO Template | |
| Advanced Cloud PostgreSQL Database Memory Template | |
| Advanced Cloud PostgreSQL Database Performance Template | |
| Advanced Cloud PostgreSQL Database Session Template | |
| Advanced Cloud PostgreSQL Database Transactions RolledBack Template | |
| G2 PostgreSQL Database Blockhits Template | |
| G2 PostgreSQL Database Connection Statistics Template | |
| G2 PostgreSQL Database CPU Utilization Template | |
| G2 PostgreSQL Database Deadlocks Template | |
| G2 PostgreSQL Database Disk Usage Template | |
| G2 PostgreSQL Database IO Template | |
| G2 PostgreSQL Database Locks Template | |
| G2 PostgreSQL Database Memory Template | |
| G2 PostgreSQL Database Performance Template | |
| G2 PostgreSQL Database Session Template | |
| G2 PostgreSQL Database Transactions Rollback Template | |
| Gateway v7 and above for MultiInstance | G2 PostgresDB Performance |
| Gateway v7 and above for MultiInstance | G2-PostgresDB-Replication Running Status |
| Gateway v10 and above for MultiInstance | G2 PostgreSQL Database BlockHits Template - MultiInstance |
| G2 PostgreSQL Database Connection Statistics Template - MultiInstance | |
| G2 PostgreSQL Database Deadlocks Template - MultiInstance | |
| G2 PostgreSQL Database Disk Usage Template - MultiInstance | |
| G2 PostgreSQL Database IO Template - MultiInstance | |
| G2 PostgreSQL Database Locks Template - MultiInstance | |
| G2 PostgreSQL Database Memory Template - MultiInstance | |
| G2 PostgreSQL Database Performance Template - MultiInstance | |
| G2 PostgreSQL Database Session Template - MultiInstance | |
| G2 PostgreSQL Database Transactions RolledBack Template - MultiInstance | |
| G2 PostgreSQL Hot Standby Feature Status Template - MultiInstance | |
| G2 PostgreSQL Activity Long Transactions Template - MultiInstance | |
| Gateway v10 and above for MultiInstance | G2-PostgresDB-PerformanceQueries |
| Gateway v10 and above for MultiInstance | G2-PostgresDB-Replication |
Supported metrics
| Metric | Metric Display Name | Unit |
|---|---|---|
| postgresql.activity.count The maximum number of connection limits and the clients displaying the database connections. | Postgresql Activity Count | - |
| postgresql.activity.long_transactions Long-running transactions are bad because they prevent Postgres from vacuuming old data. This causes database bloat and, in extreme circumstances, shutdown due to transaction ID, xid, wraparound. Transactions should be kept as short as possible, ideally less than a minute. | Postgresql Activity Long Transactions | hours(h) |
| postgresql.bgwriter.buffers_backend The number of buffers written directly by a backend. | Postgresql Bgwriter Buffers Backend | - |
| postgresql.bgwriter.buffers_checkpoint The number of buffers written during checkpoints. | Postgresql Bgwriter Buffers Checkpoint | - |
| postgresql.bgwriter.buffers_clean The number of buffers written by the background writer. | Postgresql Bgwriter Buffers Clean | - |
| postgresql.bgwriter.checkpoints_req The number of requested checkpoints that are already executed. | Postgresql Bgwriter Checkpoints Request | - |
| postgresql.bgwriter.checkpoints_timed The number of scheduled checkpoints that are already executed. | Postgresql Bgwriter Checkpoints Timed | - |
| postgresql.class.relpages Display the tables and the respective indexes in the descending order of relpages. | Postgresql Class Relpages | count |
| postgresql.database. deadlocks The number of deadlocks detected in each database. | Postgresql Database Deadlocks | count |
| postgresql.database.blkshit The number of times disk blocks were found already in the buffer cache. | Postgresql Database Blocks Hits | - |
| postgresql.database.conflict.deadlocks The number of conflicts in the database that hare cancelled due to deadlocks. | Postgresql Database Conflict Deadlocks | count |
| postgresql.database.connections The number of active connections to postgres database. | Postgresql Database Connections | - |
| postgresql.database.deadlocks The number of deadlocks detected in this database. | Postgresql Database Deadlocks | count |
| postgresql.database.rows_deleted The number of rows deleted by queries in this database. | Postgresql Database Rows Deleted | - |
| postgresql.database.rows_fetched The number of rows fetched by queries in this database. | Postgresql Database Rows Fetched | - |
| postgresql.database.rows_inserted The number of rows inserted by queries in this database. | Postgresql Database Rows Inserted | - |
| postgresql.database.rows_returned The number of rows returned by queries in this database. | Postgresql Database Rows Returned | - |
| postgresql.database.rows_updated The number of rows updated by queries in this database. | Postgresql Database Rows Updated | - |
| postgresql.database.size The size of the database. | Postgresql Database Size | gigabytes(GB) |
| postgresql.database.temp_bytes Total amount of data written to temporary files by queries in this database. All temporary files are counted, regardless of why the temporary file was created, and regardless of the log_temp_files setting. | Postgresql Database Temporary Bytes | - |